• This document will assist you in formatting and analyzing your Excel data from your
responses
• Remember to always ‘Ctrl+S’ all your Microsoft documents to save all your actions. Do this
after action you perform.
• Save your documents on your google drive to make sure you have backups.
Formatting your table
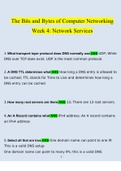
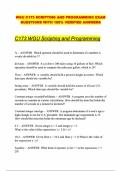
1. Select ‘Page layout’ tab
2. Select ‘Themes’ under the ‘Themes’ section. Choose a theme of your liking. Play around
with the ‘Colors’, ‘Fonts’ and ‘Effects’ to customize your table
1.
2.
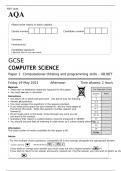
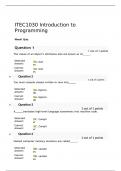
3. Select ‘Format as Table’ under ‘Styles’ section in the ‘Home’ tab.
4. Select a table formatting style and click ‘Ok’ on pop-up 3. 4.
, 5. Remove dropdown menu created by the style format. This will disturb your data
analyses in not removed. To remove this, select the table and click the ‘Table design’
tab.
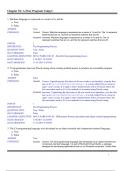
6. Select ‘Convert to Range’ on the ‘Tools’ sections and click ‘Yes’ on the pop-up
6. 5.
7. Save and close this document
8. Make a copy of this document and rename the document. The copied and renamed
document will be used for analyses (functions, graphs etc.).
Excel data analyses
You need make use of varies functions and graphs to analyse your data. They need to be
meaningful and relevant to your data. The data analysis you make will be important for your
report writing in Phase 3.
Functions
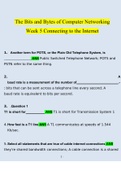
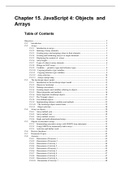
Level 1 functions
Table 1: Level one functions. Extracted from Via Afrika Grade 10 textbooks
responses
• Remember to always ‘Ctrl+S’ all your Microsoft documents to save all your actions. Do this
after action you perform.
• Save your documents on your google drive to make sure you have backups.
Formatting your table
1. Select ‘Page layout’ tab
2. Select ‘Themes’ under the ‘Themes’ section. Choose a theme of your liking. Play around
with the ‘Colors’, ‘Fonts’ and ‘Effects’ to customize your table
1.
2.
3. Select ‘Format as Table’ under ‘Styles’ section in the ‘Home’ tab.
4. Select a table formatting style and click ‘Ok’ on pop-up 3. 4.
, 5. Remove dropdown menu created by the style format. This will disturb your data
analyses in not removed. To remove this, select the table and click the ‘Table design’
tab.
6. Select ‘Convert to Range’ on the ‘Tools’ sections and click ‘Yes’ on the pop-up
6. 5.
7. Save and close this document
8. Make a copy of this document and rename the document. The copied and renamed
document will be used for analyses (functions, graphs etc.).
Excel data analyses
You need make use of varies functions and graphs to analyse your data. They need to be
meaningful and relevant to your data. The data analysis you make will be important for your
report writing in Phase 3.
Functions
Level 1 functions
Table 1: Level one functions. Extracted from Via Afrika Grade 10 textbooks