Examen
STAT 200 Week 7 Homework Problems Solutions (Approach-1), University of Maryland University College (UMUC)
Puntuación
Vendido
-
Páginas
9
Grado
A+
Subido en
16-11-2022
Escrito en
2022/2023
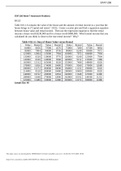
STAT 200 Week 7 Homework Problems 10.1.2 Table #10.1.6 contains the value of the house and the amount of rental income in a year that the house brings in ("Capital and rental," 2013). Create a scatter plot and find a regression equation between house value and rental income. Then use the regression equation to find the rental income a house worth $230,000 and for a house worth $400,000. Which rental income that you calculated do you think is closer to the true rental income? Why? Table #10.1.6: Data of House Value versus Rental Value Rental Value Rental Value Rental Value Rental
Mostrar más
Leer menos
Institución
Grado
Ups! No podemos cargar tu documento ahora. Inténtalo de nuevo o contacta con soporte.
Escuela, estudio y materia
- Institución
- Liberty University
- Grado
- STAT 200
Todos documentos para esta materia (16)
Información del documento
- Subido en
- 16 de noviembre de 2022
- Número de páginas
- 9
- Escrito en
- 2022/2023
- Tipo
- Examen
- Contiene
- Preguntas y respuestas
Temas
-
stat 200 week 7 homework problems solutions approach 1
-
university of maryland university college umuc
$17.99
Accede al documento completo:
100% de satisfacción garantizada
Inmediatamente disponible después del pago
Tanto en línea como en PDF
No estas atado a nada
Documento también disponible en un lote
Package deal
STAT 200 WEEK 1, WEEK 7 HOMEWORK SOLUTIONPACKAGE DEAL
7
2022
$ 118.93
Más información