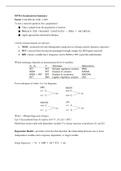
MVDA Examination Summary
Exam: 21.06.2022 @ 13:00 - 15:00
To test a research question (for a population):
● Take a sample from the population of interest
● Measure the relevant constructs → data = variables
● Apply appropriate statistical technique
3 levels of measurement are relevant
1. NOM = nominal level only distinguishes categories (no therapy, psycho-dynamic, exposure)
2. INT = interval level if intervals meaningful (weight, height, IQ, BDI (quasi-interval))
3. BIN = binary variable has 2 categories: can be NOM or INT (pass/fail, male/female)
Which technique, depends on measurement level of variables:
Four techniques of weeks 1 to 4 in diagrams:
Week 1 - Multiple Regression Analysis
Can Y be predicted from X1 and/or X2? (Y , X1, X2 = INT)
Model that works really well: dependent variable Y is a linear function of predictors X1 and X2
Regression Model = provides a function that describes the relationship between one or more
independent variables and a response, dependent, or target variable
Simple Regression → Yi = b∗0 + b∗1 X1i + ei
,Multiple Regression → Yi = b∗0 + b∗1 X1i + b∗2 X2i + · · · + b∗k Xki + ei
● b∗0 is the (population) regression constant
● b∗1 , b∗2 ,..., b∗k are (population) regression coefficients
● X1i, X2i,..., Xki and Yi are the scores on X1, X2,..., Xk and Y of individual i
● ei is a residual (= error)
The parameters b∗0 , b∗1 , b∗2 ,..., and b∗k need to be estimated
from the data (sample). Linear model: least squares estimation (e.g.
SPSS)
Linear model with one predictor: simple regression - fit a straight line
(where the line leaves the Y axis (BDI), that is the Constant point)
Best prediction (least squares) if the sum of squared differences:
Why bother with the regression model? → the regression model
describes relationship between depression (Y ) and life events (X1)
and coping (X2) in the population & it can be used to predict the
depression score of individuals that are not in the original
study/sample
Null Hypothesis = always predicts no effect or no relationship between variables
Test with →
Alternative Hypothesis = states your research prediction of an effect or relationship
Sum of squares related by:
How good is prediction? → statistic: is the
coefficient of determination
, ● R = multiple correlation coefficient
○ R is Pearson correlation between Y and combi of X1 and X2
● Value between 0 and 1 R2 reflects how much variance of Y is explained by X1 and X2
○ (VAF = variance accounted for)
● More general: R2 reflects how good the linear model describes the observed data
Another formula is:
Strong relationship → if most observed scores Yi are close to the
regression plane Yˆi
Weak relationship → if many observed scores Yi are far away from the
regression plane Yˆi
How important is a predictor?
^ is the semipartial correlation of Y and X1 corrected for X2
→ is ‘Part’ in SPSS, always a value between 1 and -1
→ ry2(1.2) reflects how much variance of Y is uniquely (only) explained by X1
Beta β = (of regression coefficient) reflects importance of the coefficient: predictors with high
absolute bet are more important
Partial Correlation = (of a predictor) reflects how much variance of Y is explained by the
predictor that is not explained by other variables in the analysis
Partial VS Semipartial Correlation
Dependent variable Y and predictors X1 and X2:
● V1 is part explained by X1
● V2 is part explained by X2
● W is part explained by X1 and X2
● U is unexplained part of Y
For the figure, the squared semipartial correlation is
while the squared partial correlation is
Assumptions of the regression model:
, ● Are needed for sampling distribution of coefficients → test
value against e.g. 0
● Can be expressed in terms of residuals ei
When assumptions are violated:
● Usually no effect on estimates of coefficients
● Effects standard errors of coefficients → wrong conclusions
about significance
Assumptions characterise the population, not the sample:
● Cannot be tested directly
● Check assumptions for the sample → if violated in sample,
unlikely to be true in population
● Check using graphical tools (useful, lack objectivity) and tests
If assumptions are violated:
● Usually no effect on estimates of coefficients
● Effects standard errors of coefficients
→ affects value of test statistics (F-value, t-values)
→ affects p-values
→ wrong conclusions about H0 and significance
Using the linear model:
● Variables have interval level of measurement
● Dependent variable is a linear combination of predictors
Testing coefficients:
Homoscedasticity = variance of residuals is constant across predicted values
● Heteroscedasticity affects standard errors of regression coefficients bj
● Homoscedasticity usually does not hold exactly
Independence of Residuals ei = individuals respond independently of one another
Normality = test for small samples, with large samples central limit theorem
Exam: 21.06.2022 @ 13:00 - 15:00
To test a research question (for a population):
● Take a sample from the population of interest
● Measure the relevant constructs → data = variables
● Apply appropriate statistical technique
3 levels of measurement are relevant
1. NOM = nominal level only distinguishes categories (no therapy, psycho-dynamic, exposure)
2. INT = interval level if intervals meaningful (weight, height, IQ, BDI (quasi-interval))
3. BIN = binary variable has 2 categories: can be NOM or INT (pass/fail, male/female)
Which technique, depends on measurement level of variables:
Four techniques of weeks 1 to 4 in diagrams:
Week 1 - Multiple Regression Analysis
Can Y be predicted from X1 and/or X2? (Y , X1, X2 = INT)
Model that works really well: dependent variable Y is a linear function of predictors X1 and X2
Regression Model = provides a function that describes the relationship between one or more
independent variables and a response, dependent, or target variable
Simple Regression → Yi = b∗0 + b∗1 X1i + ei
,Multiple Regression → Yi = b∗0 + b∗1 X1i + b∗2 X2i + · · · + b∗k Xki + ei
● b∗0 is the (population) regression constant
● b∗1 , b∗2 ,..., b∗k are (population) regression coefficients
● X1i, X2i,..., Xki and Yi are the scores on X1, X2,..., Xk and Y of individual i
● ei is a residual (= error)
The parameters b∗0 , b∗1 , b∗2 ,..., and b∗k need to be estimated
from the data (sample). Linear model: least squares estimation (e.g.
SPSS)
Linear model with one predictor: simple regression - fit a straight line
(where the line leaves the Y axis (BDI), that is the Constant point)
Best prediction (least squares) if the sum of squared differences:
Why bother with the regression model? → the regression model
describes relationship between depression (Y ) and life events (X1)
and coping (X2) in the population & it can be used to predict the
depression score of individuals that are not in the original
study/sample
Null Hypothesis = always predicts no effect or no relationship between variables
Test with →
Alternative Hypothesis = states your research prediction of an effect or relationship
Sum of squares related by:
How good is prediction? → statistic: is the
coefficient of determination
, ● R = multiple correlation coefficient
○ R is Pearson correlation between Y and combi of X1 and X2
● Value between 0 and 1 R2 reflects how much variance of Y is explained by X1 and X2
○ (VAF = variance accounted for)
● More general: R2 reflects how good the linear model describes the observed data
Another formula is:
Strong relationship → if most observed scores Yi are close to the
regression plane Yˆi
Weak relationship → if many observed scores Yi are far away from the
regression plane Yˆi
How important is a predictor?
^ is the semipartial correlation of Y and X1 corrected for X2
→ is ‘Part’ in SPSS, always a value between 1 and -1
→ ry2(1.2) reflects how much variance of Y is uniquely (only) explained by X1
Beta β = (of regression coefficient) reflects importance of the coefficient: predictors with high
absolute bet are more important
Partial Correlation = (of a predictor) reflects how much variance of Y is explained by the
predictor that is not explained by other variables in the analysis
Partial VS Semipartial Correlation
Dependent variable Y and predictors X1 and X2:
● V1 is part explained by X1
● V2 is part explained by X2
● W is part explained by X1 and X2
● U is unexplained part of Y
For the figure, the squared semipartial correlation is
while the squared partial correlation is
Assumptions of the regression model:
, ● Are needed for sampling distribution of coefficients → test
value against e.g. 0
● Can be expressed in terms of residuals ei
When assumptions are violated:
● Usually no effect on estimates of coefficients
● Effects standard errors of coefficients → wrong conclusions
about significance
Assumptions characterise the population, not the sample:
● Cannot be tested directly
● Check assumptions for the sample → if violated in sample,
unlikely to be true in population
● Check using graphical tools (useful, lack objectivity) and tests
If assumptions are violated:
● Usually no effect on estimates of coefficients
● Effects standard errors of coefficients
→ affects value of test statistics (F-value, t-values)
→ affects p-values
→ wrong conclusions about H0 and significance
Using the linear model:
● Variables have interval level of measurement
● Dependent variable is a linear combination of predictors
Testing coefficients:
Homoscedasticity = variance of residuals is constant across predicted values
● Heteroscedasticity affects standard errors of regression coefficients bj
● Homoscedasticity usually does not hold exactly
Independence of Residuals ei = individuals respond independently of one another
Normality = test for small samples, with large samples central limit theorem