Notes by Louvaine
STA1610 Important Summary
Study Unit 1,2 & 3
Descriptive Statistics:
• Collecting data
• Summarize, visualize, and present data (tables and graphs)
• Analyze data (sample mean)
Inferential Statistics
Drawing conclusions about a large group of individuals (population) based on a smaller
group (sample).
• Estimation
o E.g., Estimate the population mean weight using the sample mean weight.
• Hypothesis testing
o E.g., Test the claim that the population mean weight is 80kg.
Population = A set of all elements or items being studied, denoted by N
Measures used to describe the population are called parameters:
o Population mean, denoted by μ
o Population variance, denoted by σ2
Sample = A subset of the population; denoted by n
Measures used to describe the sample are called statistics:
o Sample mean, denoted by x̄
o Sample variance, denoted by S2
Variable = A characteristic of an item or individual that can be observed or measured.
E.g. Gender (observed) or Height (measured).
Data = The set of individual values associated with a variable, E.g. Male and Female
Observation = The set of measurements obtained for a particular element. E.g. A data set with
22 elements has 22 observations.
, Notes by Louvaine
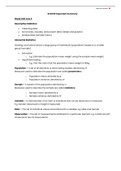
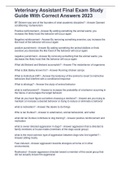
Types of Variables
Categorical / Qualitative Numerical / Quantitative
Discrete Continuous
Defined Categories Counted Items Measured Items
(Whole Numbers)
Marital Status, Political Party, Eye Number of people, Weight, Height, Voltage,
Color, Job Position, List or name of Defects per hour, Age in Money, Temperature,
provinces, Car Model etc. years or months etc. Length, Age
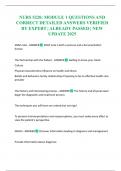
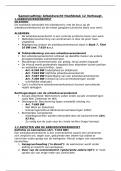
Levels of Measurements
In statistics, data can be classified into four scales (levels) of measurement . Highest Level /
Strongest
Measurement
• Difference between measurements & true zero
Ratio Scale exists. E.g. Weight, Distance, Stock
• Difference between measurements, but no true
Interval Scale zero exists. E.g. Temperature, Time, Bank Balance
Higher Levels
Ordinal Scale • Categories with ORDER. E.g. Size, Rank, Position
Nominal Scale • Categories with NO ORDER. E.g. Gender, Yes / No
Lowest Level /
Weakest
Measurement
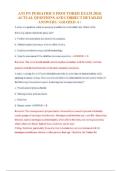
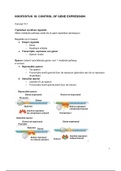
Levels / Scales of Measurement Comparisons
Nominal Ordinal Interval Ratio
Order
Counts (Frequency)
Mode
Median
Difference (add or subtract)
Ratio (multiply or divide)
Absolute zero
, Notes by Louvaine
Frequency Tables
𝐹𝑟𝑒𝑞𝑢𝑒𝑛𝑐𝑦
Relative Frequency =
𝑛
𝐹𝑟𝑒𝑞𝑢𝑒𝑛𝑐𝑦
Percentage Frequency = x 100
𝑛
Maximum data value−Minimum data value (Range)
Width of Classes (for Quantitative Data)=
Number of Classes (usually b/w 5−15)
Pie Charts
Slice Percentage = Frequency ÷ Total Frequency x 100
--------------------------------------------------------------------------------
Measures of Location (Central Tendency)
∑ 𝑥𝑖 ∑ 𝑥𝑖
Sample mean: 𝑥̅ = Population mean: 𝜇=
𝑛 𝑁
• Mean = sum of values divided by the number of values
• Most common measure of central tendency, affected by outliers
𝑛+1
Median position = median is affected by outliers
2
Mode: Value that occurs most often, not affected by outliers
--------------------------------------------------------------------------------
Quartiles
(𝑛+1 )
First Quartile Position: 𝑄1 = ranked value
4
(𝑛+1 )
Second Quartile Position: 𝑄2 = ranked value (median)
2
3(𝑛+1 )
Third Quartile Position: 𝑄3 = ranked value
4
--------------------------------------------------------------------------------
, Notes by Louvaine
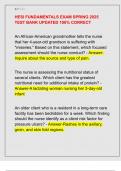
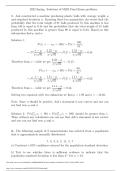
Measures of Variation
Variance Standard Deviation
Most commonly used measure of variation
Sample Sample
Variance Standard
Deviation
Population
Population Standard
Variance Deviation
Range = Highest Data Value – Lowest Data Value
𝑆
Coefficient of Variation: 𝐶𝑉 = ( ) × 100
𝑥̅
Interquartile Range (IQR) = Q3 – Q1
IQR is not affected by outliers.
--------------------------------------------------------------------------------
5 Number Summary & Boxplot:
An observation is classified as an outlier if its value is less than the lower limit or greater than
the upper limit.
Lower Limit = Q1 − 1.5 (IQR)
Upper Limit = Q3 + 1.5 (IQR)
STA1610 Important Summary
Study Unit 1,2 & 3
Descriptive Statistics:
• Collecting data
• Summarize, visualize, and present data (tables and graphs)
• Analyze data (sample mean)
Inferential Statistics
Drawing conclusions about a large group of individuals (population) based on a smaller
group (sample).
• Estimation
o E.g., Estimate the population mean weight using the sample mean weight.
• Hypothesis testing
o E.g., Test the claim that the population mean weight is 80kg.
Population = A set of all elements or items being studied, denoted by N
Measures used to describe the population are called parameters:
o Population mean, denoted by μ
o Population variance, denoted by σ2
Sample = A subset of the population; denoted by n
Measures used to describe the sample are called statistics:
o Sample mean, denoted by x̄
o Sample variance, denoted by S2
Variable = A characteristic of an item or individual that can be observed or measured.
E.g. Gender (observed) or Height (measured).
Data = The set of individual values associated with a variable, E.g. Male and Female
Observation = The set of measurements obtained for a particular element. E.g. A data set with
22 elements has 22 observations.
, Notes by Louvaine
Types of Variables
Categorical / Qualitative Numerical / Quantitative
Discrete Continuous
Defined Categories Counted Items Measured Items
(Whole Numbers)
Marital Status, Political Party, Eye Number of people, Weight, Height, Voltage,
Color, Job Position, List or name of Defects per hour, Age in Money, Temperature,
provinces, Car Model etc. years or months etc. Length, Age
Levels of Measurements
In statistics, data can be classified into four scales (levels) of measurement . Highest Level /
Strongest
Measurement
• Difference between measurements & true zero
Ratio Scale exists. E.g. Weight, Distance, Stock
• Difference between measurements, but no true
Interval Scale zero exists. E.g. Temperature, Time, Bank Balance
Higher Levels
Ordinal Scale • Categories with ORDER. E.g. Size, Rank, Position
Nominal Scale • Categories with NO ORDER. E.g. Gender, Yes / No
Lowest Level /
Weakest
Measurement
Levels / Scales of Measurement Comparisons
Nominal Ordinal Interval Ratio
Order
Counts (Frequency)
Mode
Median
Difference (add or subtract)
Ratio (multiply or divide)
Absolute zero
, Notes by Louvaine
Frequency Tables
𝐹𝑟𝑒𝑞𝑢𝑒𝑛𝑐𝑦
Relative Frequency =
𝑛
𝐹𝑟𝑒𝑞𝑢𝑒𝑛𝑐𝑦
Percentage Frequency = x 100
𝑛
Maximum data value−Minimum data value (Range)
Width of Classes (for Quantitative Data)=
Number of Classes (usually b/w 5−15)
Pie Charts
Slice Percentage = Frequency ÷ Total Frequency x 100
--------------------------------------------------------------------------------
Measures of Location (Central Tendency)
∑ 𝑥𝑖 ∑ 𝑥𝑖
Sample mean: 𝑥̅ = Population mean: 𝜇=
𝑛 𝑁
• Mean = sum of values divided by the number of values
• Most common measure of central tendency, affected by outliers
𝑛+1
Median position = median is affected by outliers
2
Mode: Value that occurs most often, not affected by outliers
--------------------------------------------------------------------------------
Quartiles
(𝑛+1 )
First Quartile Position: 𝑄1 = ranked value
4
(𝑛+1 )
Second Quartile Position: 𝑄2 = ranked value (median)
2
3(𝑛+1 )
Third Quartile Position: 𝑄3 = ranked value
4
--------------------------------------------------------------------------------
, Notes by Louvaine
Measures of Variation
Variance Standard Deviation
Most commonly used measure of variation
Sample Sample
Variance Standard
Deviation
Population
Population Standard
Variance Deviation
Range = Highest Data Value – Lowest Data Value
𝑆
Coefficient of Variation: 𝐶𝑉 = ( ) × 100
𝑥̅
Interquartile Range (IQR) = Q3 – Q1
IQR is not affected by outliers.
--------------------------------------------------------------------------------
5 Number Summary & Boxplot:
An observation is classified as an outlier if its value is less than the lower limit or greater than
the upper limit.
Lower Limit = Q1 − 1.5 (IQR)
Upper Limit = Q3 + 1.5 (IQR)