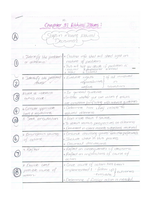
1. Terms
Experimental/observational unit Units to which treatments are (randomly) assigned.
Measurement unit Parts of the experimental units where the response is measured.
Population The population consists of experimental units about whom the
researcher wants to know something. The population is the group
from which the experimental units are drawn to form the sample.
The conclusion will be valid for the population.
Sample Represents a subset of manageable size.
Treatment Treatments are randomly assigned to the units.
Response variable A quantity that someone wants to measure. Variable of interest,
on the left in the model expression, often called y.
Random variable A numerical description of the outcome of a statistical
experiment.
Probability The measure of the likelihood that an event will occur in a
random experiment. How far is the test statistic in the tail it
tells how well the data fits the hypothesis.
Normal distribution An arrangement of a data set in which most calues cluster in the
middle of the range and the rst taper off symmetrically toward
extreme. It has a bell shape, the mean and median are equal, and
68% of the data falls within 1 standard deviation.
It is measured using QQ-plots.
Variance The expectation of the squared deviation of a random variable
from its population mean or sample mean.
Equal variances Although different samples can come from populations with
different means, they have the same variance. It occurs when the
variances are approximately the same across the samples.
P-value Probability of obtaining results at least as extreme as the observed
results of a statistical hypothesis test (so in direction of Ha),
assuming that the H0 is correct
t-value Measures the size of the difference relative to the variation in
your sample data.
f-value Indicates whether your linear regression model provides a better
fit to the data than a model that contains no independent
variables.
Rejection region/critical region The region where, if our test statistic falls, then we have enough
evidence to reject the 0-hypothesis.
Estimator Estimates some fact about the population.
Standard error The standard deviation of its sampling distribution or and
estimate of that standard deviation. It tells you how accurate the
mean of any given sample from that population is likely to be
compared to the true population mean.
Standard deviation The measure of dispersion of a set of data from its mean.
Error margin The amount of random sampling error in the results. It falls
mostly between 4% and 8% at the 95% CI. It is affected by
sample size, population size and percentage.
Power The probability that a test of significance will detect a deviation
from the 0-hypothesis, should such a deviation exist.
Factor Controlled variable (qualitative or quantitative). Often ‘factor’
reserved for a qualitative explanatory variable and quantitative
explanatory variable may referred to as covariate.
,Factor levels The levels of the factor in the experiment
Treatments Combinations of the factor levels of factors in the experiment
Blocks Groups of similar experimental units, entered into the model to
reduce the error variance
Replications Repetitions of treatments (often letter n is used).
Control treatment To monitor experimental conditions, the standard method for
comparison or placebo.
Binomial distribution Inference about probability or population proportion
Hypergeometric distribution Fisher´S exact test in 2x2 or larger tables
Chi2 distribution For approximate p-value for tests for goodness of fit, independent
and homogeneity
t-distribution For population mean or difference between means, or for paired
data, also in regression, ANOVA and ANCOVA
Studentized range distribution Tukey’s method for pairwise comparisons
F-distribution In regression, ANOVA, ANCOVA, full vs. reduced model extra
sum of squares
Distribution for rank tests Tables are exact, traditionally approximation by Chi 2 distribution,
but t-test, F-test on ranks is better.
Difference between the designs:
A completely randomized design
A randomized complete block design
A simple random sample of cows
A simple random sample of dairy farms
Completely randomized design and randomized complete block design cannot be observational studies.
Symbol Definition
Sample variance
s2
Sample mean
y̅
Population mean
μ
Population standard deviation
σ/s.d/s
Equal variances
σ2
Degrees of freedom (t-distribution parameter)
df
D0
P, probability or proportion
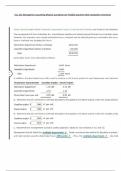
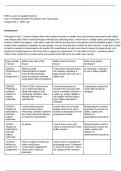
,1.1. The P-value
P-value: Probability under H0 for the outcome of test statistic t and anything more
extreme (supporting Ha).
1.2. Alternative: The rejection region (RR)
Rejection occurs when the outcome of the test statistic t is too small ( very negative direction
Ha).
The green area forms the RR: the outcomes of t that lead to rejection of H0.
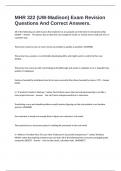
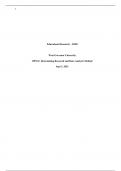
1.3. PQRS
Fill in the values
o T distribution with v = df
o P-value: 0.0166 fill in in red place
o Outcome T.S.: -2.272
RR: all outcomes of t smaller than -1.717 (for example)
, Outcome was -2.272 is within the rejection region H0 rejected.
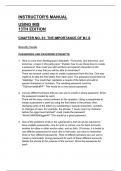
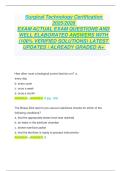
1.4. One- and two-sided p-value
One-sided p-value
We expect the drug to be better than no treatment at all. Ha: 𝜇1 − 𝜇2 < 0
Left or right tailed
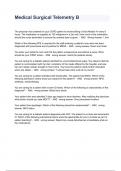
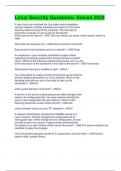
Two-sided p-value
We expect the drug to be different than no treatment at all. Ha: 𝜇1 − 𝜇2 ≠ 0
Reject when outcome of test statistic t is too large (very positive) or too small (very negative).
The red and green areas form the RR: the outcomes of t that lead to rejection of H0.
RR are all outcomes of t smaller than -2.074 and all outcomes of t larger than +2.074.
critical region: (-∞, –2.074) and (+2.074, ∞)
1.5. Equal variances
If variances of both samples are not equal, we can not pool the variances in Sp use of different
expression of the standard error
Experimental/observational unit Units to which treatments are (randomly) assigned.
Measurement unit Parts of the experimental units where the response is measured.
Population The population consists of experimental units about whom the
researcher wants to know something. The population is the group
from which the experimental units are drawn to form the sample.
The conclusion will be valid for the population.
Sample Represents a subset of manageable size.
Treatment Treatments are randomly assigned to the units.
Response variable A quantity that someone wants to measure. Variable of interest,
on the left in the model expression, often called y.
Random variable A numerical description of the outcome of a statistical
experiment.
Probability The measure of the likelihood that an event will occur in a
random experiment. How far is the test statistic in the tail it
tells how well the data fits the hypothesis.
Normal distribution An arrangement of a data set in which most calues cluster in the
middle of the range and the rst taper off symmetrically toward
extreme. It has a bell shape, the mean and median are equal, and
68% of the data falls within 1 standard deviation.
It is measured using QQ-plots.
Variance The expectation of the squared deviation of a random variable
from its population mean or sample mean.
Equal variances Although different samples can come from populations with
different means, they have the same variance. It occurs when the
variances are approximately the same across the samples.
P-value Probability of obtaining results at least as extreme as the observed
results of a statistical hypothesis test (so in direction of Ha),
assuming that the H0 is correct
t-value Measures the size of the difference relative to the variation in
your sample data.
f-value Indicates whether your linear regression model provides a better
fit to the data than a model that contains no independent
variables.
Rejection region/critical region The region where, if our test statistic falls, then we have enough
evidence to reject the 0-hypothesis.
Estimator Estimates some fact about the population.
Standard error The standard deviation of its sampling distribution or and
estimate of that standard deviation. It tells you how accurate the
mean of any given sample from that population is likely to be
compared to the true population mean.
Standard deviation The measure of dispersion of a set of data from its mean.
Error margin The amount of random sampling error in the results. It falls
mostly between 4% and 8% at the 95% CI. It is affected by
sample size, population size and percentage.
Power The probability that a test of significance will detect a deviation
from the 0-hypothesis, should such a deviation exist.
Factor Controlled variable (qualitative or quantitative). Often ‘factor’
reserved for a qualitative explanatory variable and quantitative
explanatory variable may referred to as covariate.
,Factor levels The levels of the factor in the experiment
Treatments Combinations of the factor levels of factors in the experiment
Blocks Groups of similar experimental units, entered into the model to
reduce the error variance
Replications Repetitions of treatments (often letter n is used).
Control treatment To monitor experimental conditions, the standard method for
comparison or placebo.
Binomial distribution Inference about probability or population proportion
Hypergeometric distribution Fisher´S exact test in 2x2 or larger tables
Chi2 distribution For approximate p-value for tests for goodness of fit, independent
and homogeneity
t-distribution For population mean or difference between means, or for paired
data, also in regression, ANOVA and ANCOVA
Studentized range distribution Tukey’s method for pairwise comparisons
F-distribution In regression, ANOVA, ANCOVA, full vs. reduced model extra
sum of squares
Distribution for rank tests Tables are exact, traditionally approximation by Chi 2 distribution,
but t-test, F-test on ranks is better.
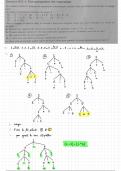
Difference between the designs:
A completely randomized design
A randomized complete block design
A simple random sample of cows
A simple random sample of dairy farms
Completely randomized design and randomized complete block design cannot be observational studies.
Symbol Definition
Sample variance
s2
Sample mean
y̅
Population mean
μ
Population standard deviation
σ/s.d/s
Equal variances
σ2
Degrees of freedom (t-distribution parameter)
df
D0
P, probability or proportion
,1.1. The P-value
P-value: Probability under H0 for the outcome of test statistic t and anything more
extreme (supporting Ha).
1.2. Alternative: The rejection region (RR)
Rejection occurs when the outcome of the test statistic t is too small ( very negative direction
Ha).
The green area forms the RR: the outcomes of t that lead to rejection of H0.
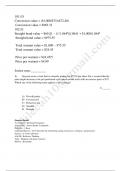
1.3. PQRS
Fill in the values
o T distribution with v = df
o P-value: 0.0166 fill in in red place
o Outcome T.S.: -2.272
RR: all outcomes of t smaller than -1.717 (for example)
, Outcome was -2.272 is within the rejection region H0 rejected.
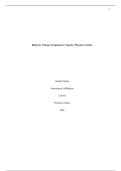
1.4. One- and two-sided p-value
One-sided p-value
We expect the drug to be better than no treatment at all. Ha: 𝜇1 − 𝜇2 < 0
Left or right tailed
Two-sided p-value
We expect the drug to be different than no treatment at all. Ha: 𝜇1 − 𝜇2 ≠ 0
Reject when outcome of test statistic t is too large (very positive) or too small (very negative).
The red and green areas form the RR: the outcomes of t that lead to rejection of H0.
RR are all outcomes of t smaller than -2.074 and all outcomes of t larger than +2.074.
critical region: (-∞, –2.074) and (+2.074, ∞)
1.5. Equal variances
If variances of both samples are not equal, we can not pool the variances in Sp use of different
expression of the standard error