CHAPTER 11 No potential is recorded in the ECG when the ventricular muscle
is either completely polarized or depolarized which means that
FUNDAMENTALS OF ELECTROCARDIOGRAPHY there is current flow only during partial polarization until partial
depolarization.
When a cardiac impulse passes through the heart, electrical
current also spreads from the heart into the adjacent tissues ATRIAL AND VENTRICULAR CONTRACTION AND TH
surrounding the heart, and a small portion of the current spreads WAVES OF THE ECG
all the way to the surface of the body
Depolarization first before contraction of the muscle.
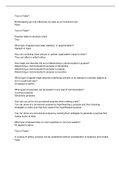
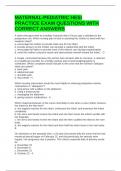
WAVEFORMS OF THE NORMAL ELECTROCARGIOGRAM
P wave occurs at the beginning of contraction of the atria, QRS
The normal ECG is composed of a P wave, a QRS complex complex occurs at the beginning of ventricular contraction.
(often 3 separate waves), and a T wave. Ventricles remain contracted after occurrence of repolarization
which is until after the end of the T wave.
Depolarization (where the current becomes more positive:
P wave – atrial depolarization before atrial contraction
Q wave – ventricular depolarization before contraction
Repolarization:
T wave – ventricular repolarization aka repolarization
wave
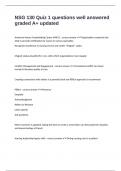
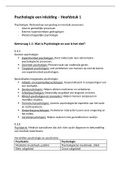
CARDIAC DEPOLARIZATION VS REPOLARIZATION WAVES
During depolarization, the normal negative potential inside the
fiber reverses and becomes slightly positive inside and negative
outside.
Atria will repolarize 0.15-0.20 s after termination of the P wave,
A – first half of the fiber has already depolarized; the left approx. at the time of QRS wave. This means that the atrial T
electrode on the outside of the fiber is in an area of negativity, wave is usually obscured by the much larger QRS complex and
and the right electrode is in an area of positivity; meter will the atrial T wave is seldom observed on the ECG.
record positive;
Ventricular repolarization is the T wave of the normal ECG. This
when depolarization
is because the process of ventricular repolarization extends over
has reached the
a long period, which is why the T wave in a normal ECG is a
halfway mark, the
prolonged wave, with a considerably less voltage.
recording on the
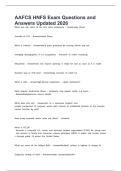
right has risen to a ECG CALIBRATION AND DISPLAY
maximum positive
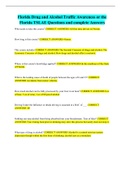
value. All recordings of ECGs are made with appropriate calibration
lines on the display grid.
B – depolarization
has extended over The horizontal calibration lines are arranged so that 10 of the
the entire muscle fiber; recording has returned to 0 baseline; the small line divisions upward (+) or downward (-) in the standard
completed wave is a depolarization wave because it results from ECG represent 1 millivolt.
the spread of depolarization along the muscle fiber membrane.
The vertical lines are time calibration lines. A typical ECG is run
C – halfway repolarization of the same muscle fiber, with at a speed of 25 millimeters per second. Each 5mm segment,
positivity returning to the outside of the fiber. At this point, the indicated by the dark vertical lines, represent 0.2 second, which
left electrode is in an area of negativity. This polarity is opposite are further broken into 5 smaller intervals each of which
to the polarity in A. represent 0.04 second.
The recording
becomes negative. The recorded voltages of the waves in the normal ECG depend
on the manner in which the electrodes are applied to the surface
D – the muscle of the body, and how close the electrodes are to the heart.
fiber has
completely P-Q interval – aka P-R interval; the time between the beginning
repolarized, both of excitation of the atria and the beginning of excitation of the
electrodes are now in areas of positivity so that no potential ventricles. Normal is at 0.16s. Time interval is directly
difference is recorded between them. In the recording, the proportional with the heart rate.
potential returns to 0. This completed wave is a repolarization Q-T interval – contraction of the ventricle. Normal is at 0.35s.
wave because it results from the spread of repolarization along
the muscle fiber membrane. The heart rate can easily be determined from an ECG because
the heart rate is the reciprocal of the time between 2 heartbeats.
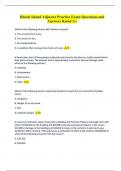
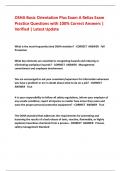
MONOPHASIC ACTION POTENTIAL OF THE VENTRICULAR R-R interval. Normal is at 0.83s or 60/0.83x/min or 72bpm.
MUSCLE AND THE QRS AND T WAVES IN THE ECG
The depolarization stage
(beginning of) in the
monophasic action potential
represents is simultaneous
with the QRS waves.
The T wave appears at the
end.
is either completely polarized or depolarized which means that
FUNDAMENTALS OF ELECTROCARDIOGRAPHY there is current flow only during partial polarization until partial
depolarization.
When a cardiac impulse passes through the heart, electrical
current also spreads from the heart into the adjacent tissues ATRIAL AND VENTRICULAR CONTRACTION AND TH
surrounding the heart, and a small portion of the current spreads WAVES OF THE ECG
all the way to the surface of the body
Depolarization first before contraction of the muscle.
WAVEFORMS OF THE NORMAL ELECTROCARGIOGRAM
P wave occurs at the beginning of contraction of the atria, QRS
The normal ECG is composed of a P wave, a QRS complex complex occurs at the beginning of ventricular contraction.
(often 3 separate waves), and a T wave. Ventricles remain contracted after occurrence of repolarization
which is until after the end of the T wave.
Depolarization (where the current becomes more positive:
P wave – atrial depolarization before atrial contraction
Q wave – ventricular depolarization before contraction
Repolarization:
T wave – ventricular repolarization aka repolarization
wave
CARDIAC DEPOLARIZATION VS REPOLARIZATION WAVES
During depolarization, the normal negative potential inside the
fiber reverses and becomes slightly positive inside and negative
outside.
Atria will repolarize 0.15-0.20 s after termination of the P wave,
A – first half of the fiber has already depolarized; the left approx. at the time of QRS wave. This means that the atrial T
electrode on the outside of the fiber is in an area of negativity, wave is usually obscured by the much larger QRS complex and
and the right electrode is in an area of positivity; meter will the atrial T wave is seldom observed on the ECG.
record positive;
Ventricular repolarization is the T wave of the normal ECG. This
when depolarization
is because the process of ventricular repolarization extends over
has reached the
a long period, which is why the T wave in a normal ECG is a
halfway mark, the
prolonged wave, with a considerably less voltage.
recording on the
right has risen to a ECG CALIBRATION AND DISPLAY
maximum positive
value. All recordings of ECGs are made with appropriate calibration
lines on the display grid.
B – depolarization
has extended over The horizontal calibration lines are arranged so that 10 of the
the entire muscle fiber; recording has returned to 0 baseline; the small line divisions upward (+) or downward (-) in the standard
completed wave is a depolarization wave because it results from ECG represent 1 millivolt.
the spread of depolarization along the muscle fiber membrane.
The vertical lines are time calibration lines. A typical ECG is run
C – halfway repolarization of the same muscle fiber, with at a speed of 25 millimeters per second. Each 5mm segment,
positivity returning to the outside of the fiber. At this point, the indicated by the dark vertical lines, represent 0.2 second, which
left electrode is in an area of negativity. This polarity is opposite are further broken into 5 smaller intervals each of which
to the polarity in A. represent 0.04 second.
The recording
becomes negative. The recorded voltages of the waves in the normal ECG depend
on the manner in which the electrodes are applied to the surface
D – the muscle of the body, and how close the electrodes are to the heart.
fiber has
completely P-Q interval – aka P-R interval; the time between the beginning
repolarized, both of excitation of the atria and the beginning of excitation of the
electrodes are now in areas of positivity so that no potential ventricles. Normal is at 0.16s. Time interval is directly
difference is recorded between them. In the recording, the proportional with the heart rate.
potential returns to 0. This completed wave is a repolarization Q-T interval – contraction of the ventricle. Normal is at 0.35s.
wave because it results from the spread of repolarization along
the muscle fiber membrane. The heart rate can easily be determined from an ECG because
the heart rate is the reciprocal of the time between 2 heartbeats.
MONOPHASIC ACTION POTENTIAL OF THE VENTRICULAR R-R interval. Normal is at 0.83s or 60/0.83x/min or 72bpm.
MUSCLE AND THE QRS AND T WAVES IN THE ECG
The depolarization stage
(beginning of) in the
monophasic action potential
represents is simultaneous
with the QRS waves.
The T wave appears at the
end.