Lectures Criminal Behavior over the Life Course
Lecture 1
Weekly learning goals:
• Explain Elder’s life course research concepts and be able to apply them to real life
examples and criminal behavior.
• Understand the age-crime curve and be able to explain how and why it may vary
across different types of crimes. Be able to reconstruct and critically assess the
debate about age and crime (Hirschi & Gottfredson vs Steffensmeier et al).
• Be able to read and critically interpret a life history calendar.
• Explain the components of a criminal career and be able to identify them based on a
life history calendar.
Age and crime
- Fact: adolescents and young adults commit a disproportionate amount of crime.
- Data:
o Official data: Arrests peak in late teens/early 20s
o Self report: Teens and young adults report more
criminal behavior than other age groups
o Victim surveys: Victims most commonly report
offenders to be teenagers/young adults
Aggregate age crime curve → classic picture, peek in the teens
Example arrest data on age and crime
- Youths aged 13-17 make up about 6% of the US
population, but they account for about 20% of all
“index crime” arrests
o Homicide, aggravated assault, robbery, rape, arson, burglary, larceny, motor
vehicle theft
- Adults over 45 make up 32% of the population but account for only 8% of index crime
arrests
Setting the stage
- Until 1970s/80s, much research on crime
focused on adolescents
o Find a group of youth (look in schools)
o Have them fill out surveys (get juicy
deets)
o Test your theory (prove them wrong)
o Repeat!
- Growing interest in criminal behavior over time
o “Criminal careers”
, o Small percentage of offenders account for majority of crimes
o 6% -> 52% of all crimes (Philadelphia Birth Cohort 1945, Wolfgang et al. 1979)
Enter
- Hirschi & Gottfredson 1983 (anti life course guys)
o Age-crime curve one of the “brute facts of criminology”
- Crime declines with age: “maturational reform”, “ageing-out”
o Invariant
o Consistent explanations across age
o Difference in degree
- So…why do we need criminal careers and longitudinal research?
The great debate
All we need is age and propensity?
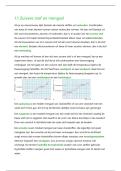
Age-crime curve
Why does crime decline with age?
- Changes in social roles and context
- “Society at large is faced perennially with an invasion of
barbarians... [and] every adult generation is faced with the
task of civilizing those barbarians” (Ryder)
This is going to depend on the type of crime.
(eg. burglary requires different skills than fraud)
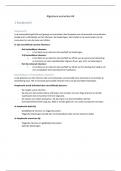
Different age curves for different crimes —> Steffensmeier et al.
(1989)
PAI = percentage age involvement →
D’Unger et al 2002
- Philadelphia birth cohort (1958)
- 13,000 females, 14,000 males
- Followed from age 10-26 (1968-1984)
- Study sample: 3,000 females, 1,000 males
Lecture 1
Weekly learning goals:
• Explain Elder’s life course research concepts and be able to apply them to real life
examples and criminal behavior.
• Understand the age-crime curve and be able to explain how and why it may vary
across different types of crimes. Be able to reconstruct and critically assess the
debate about age and crime (Hirschi & Gottfredson vs Steffensmeier et al).
• Be able to read and critically interpret a life history calendar.
• Explain the components of a criminal career and be able to identify them based on a
life history calendar.
Age and crime
- Fact: adolescents and young adults commit a disproportionate amount of crime.
- Data:
o Official data: Arrests peak in late teens/early 20s
o Self report: Teens and young adults report more
criminal behavior than other age groups
o Victim surveys: Victims most commonly report
offenders to be teenagers/young adults
Aggregate age crime curve → classic picture, peek in the teens
Example arrest data on age and crime
- Youths aged 13-17 make up about 6% of the US
population, but they account for about 20% of all
“index crime” arrests
o Homicide, aggravated assault, robbery, rape, arson, burglary, larceny, motor
vehicle theft
- Adults over 45 make up 32% of the population but account for only 8% of index crime
arrests
Setting the stage
- Until 1970s/80s, much research on crime
focused on adolescents
o Find a group of youth (look in schools)
o Have them fill out surveys (get juicy
deets)
o Test your theory (prove them wrong)
o Repeat!
- Growing interest in criminal behavior over time
o “Criminal careers”
, o Small percentage of offenders account for majority of crimes
o 6% -> 52% of all crimes (Philadelphia Birth Cohort 1945, Wolfgang et al. 1979)
Enter
- Hirschi & Gottfredson 1983 (anti life course guys)
o Age-crime curve one of the “brute facts of criminology”
- Crime declines with age: “maturational reform”, “ageing-out”
o Invariant
o Consistent explanations across age
o Difference in degree
- So…why do we need criminal careers and longitudinal research?
The great debate
All we need is age and propensity?
Age-crime curve
Why does crime decline with age?
- Changes in social roles and context
- “Society at large is faced perennially with an invasion of
barbarians... [and] every adult generation is faced with the
task of civilizing those barbarians” (Ryder)
This is going to depend on the type of crime.
(eg. burglary requires different skills than fraud)
Different age curves for different crimes —> Steffensmeier et al.
(1989)
PAI = percentage age involvement →
D’Unger et al 2002
- Philadelphia birth cohort (1958)
- 13,000 females, 14,000 males
- Followed from age 10-26 (1968-1984)
- Study sample: 3,000 females, 1,000 males