LECTURES CUSTOMER AND MARKETING ANALYTICS 2022
Taught by: Aylin Aydinli
Overview of all the lectures for the course Consumer Marketing
Lecture 1: Introduction p2
Lecture 2: Basic Statistical Analysis p3
Lecture 3: Measurement and scaling: reliability, validity and dimensionality p10
Lecture 4: Creating perceptual maps (using Factor Analysis) p18
Lecture 5: Market Response Models p22
Lecture 6: Mediation and Moderation p29
Lecture 7&8: Predicting Customer Response using RFM Approach (Logistic p31
Regression Analysis)
Lecture 9&10: Understanding Individual Customer Preferences Using Conjoint p36
Analysis
Lecture 11: Course wrap-up (processed in the lectures)
1
,Lecture 1: Introduction
Why do firms do research in Marketing?
Marketers use “the right” principle “to do” marketing
get the right products to the right people at the right place at the right time at the right
price using the right promotion techniques.
To be “right” in marketing: need for decision making information that reduces uncertainty to
aid in smarter managerial decision making.
Marketing research
Planning, collection, and analysis of data relevant to marketing decision making and the
communication of the results of this analysis to management.
It can be micro-level (individual) or macro-level (market) in nature.
Value of marketing research:
- Decreased uncertainty
- Increased likelihood of a correct decision
- Improved marketing performance and resulting higher profits
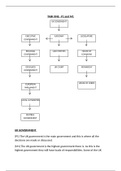
1) Identifying the problem and problem definition
Marketing decision problem Marketing research problem
Asks what the decision-maker needs to do Asks what information is needed and how it
can best be obtained
Action oriented Information oriented
Focuses on the symptoms Focuses on the underlying causes
2) From decision problem to research problem
Example:
Decision problem: What logo design should we use for
the Olympics in London?
Research problem: How much do people like the different
proposed logos?
2
, 3) Classifying marketing research
a) Type of data
Quantitative research Qualitative research
Focus on numbers Not concerned with numbers
Profiling detailed usage and behavior Mapping the customer’s overall range of
behavior and attitude
Highlighting variations between sub-groups Pinpointing motivations behind people’s
behavior
Precisely measuring consumer preferences Stimulating new and creative ideas
b) Research design
Exploratory research Descriptive research Causal research
Emphasis on gaining ideas Often guided by an initial Determining a cause-and-
and insights hypothesis effect relationship
Clarify concepts Describe characteristics of Reveal associations between
certain group changes in variables
Develop specific hypotheses Examine associations
between two or more
variables
Make specific predictions
Qualitative research Quantitative research Quantitative research
c) Data source
Primary data Secondary data
Data collected specifically to answer the Data previously collected for purposes other
question(s) posed by the research (e.g., than the research at hand (e.g., customer
demographics) transaction databases)
Syndicated research
Large-scale marketing research that is
undertaken by a research firm and sold to
clients/companies
Lecture 2: Basic Statistical Analysis
1) Screen dataset: investigate quality of data
a) Error, missing values, inconsistencies
b) Explore and analyze the data
2) Describe and summarize data: a complete run-down analysis of all the variables in
your dataset one-at-a-time (univariate statistics)
a) Inferential analysis: learning about “the world” (univariate statistics)
b) Differential analysis (bivariate)
c) Associative analysis: (bivariate)
Descriptive analysis: used to describe the data set; frequency distributions and summary
statistics.
Inferential analysis: used to generate conclusions about the population’s characteristics
based on the sample data; confidence intervals and hypothesis testing.
3
, Differences analysis: used to compare the mean of the responses of one group to that of
another group; testing differences between samples.
Associative analysis: determines the strength and direction of relationships between two or
more variables; cross-tabulations and correlations.
Screening the dataset
- Check for missing data
o Some people miss questions in surveys
o Sometimes it is part of the research design (I don’t know)
- Find “strange codes” and errors
o Consistency checks (out of range, logically inconsistent, extreme values)
- Reverse coding (e.g., reversing negatively worded items)
Dealing with missing data
Is the missing data ignorable?
If it is part of the research design, YES. Otherwise, NO and you can:
- Assign missing values (calculating replacement values)
Or
- Delete missing values
o Exclude cases listwise: the person is excluded from the whole analysis.
o Exclude cases pairwise: a person’s data is excluded only for analyses for which
she has missing data. However, then you cannot compare analyses.
Level of measurement
Non-metric/categorical:
- Nominal
o Assigns numbers to identify subjects or objects
o Nothing is implied by the numbers other than identification
o E.g., student number, gender, region, brand chosen.
- Ordinal
o Ranking of objects
o Numbers indicate relative positions, but amount of difference between
numbers is unkown
o E.g., preference of brands or other ranking.
4
Taught by: Aylin Aydinli
Overview of all the lectures for the course Consumer Marketing
Lecture 1: Introduction p2
Lecture 2: Basic Statistical Analysis p3
Lecture 3: Measurement and scaling: reliability, validity and dimensionality p10
Lecture 4: Creating perceptual maps (using Factor Analysis) p18
Lecture 5: Market Response Models p22
Lecture 6: Mediation and Moderation p29
Lecture 7&8: Predicting Customer Response using RFM Approach (Logistic p31
Regression Analysis)
Lecture 9&10: Understanding Individual Customer Preferences Using Conjoint p36
Analysis
Lecture 11: Course wrap-up (processed in the lectures)
1
,Lecture 1: Introduction
Why do firms do research in Marketing?
Marketers use “the right” principle “to do” marketing
get the right products to the right people at the right place at the right time at the right
price using the right promotion techniques.
To be “right” in marketing: need for decision making information that reduces uncertainty to
aid in smarter managerial decision making.
Marketing research
Planning, collection, and analysis of data relevant to marketing decision making and the
communication of the results of this analysis to management.
It can be micro-level (individual) or macro-level (market) in nature.
Value of marketing research:
- Decreased uncertainty
- Increased likelihood of a correct decision
- Improved marketing performance and resulting higher profits
1) Identifying the problem and problem definition
Marketing decision problem Marketing research problem
Asks what the decision-maker needs to do Asks what information is needed and how it
can best be obtained
Action oriented Information oriented
Focuses on the symptoms Focuses on the underlying causes
2) From decision problem to research problem
Example:
Decision problem: What logo design should we use for
the Olympics in London?
Research problem: How much do people like the different
proposed logos?
2
, 3) Classifying marketing research
a) Type of data
Quantitative research Qualitative research
Focus on numbers Not concerned with numbers
Profiling detailed usage and behavior Mapping the customer’s overall range of
behavior and attitude
Highlighting variations between sub-groups Pinpointing motivations behind people’s
behavior
Precisely measuring consumer preferences Stimulating new and creative ideas
b) Research design
Exploratory research Descriptive research Causal research
Emphasis on gaining ideas Often guided by an initial Determining a cause-and-
and insights hypothesis effect relationship
Clarify concepts Describe characteristics of Reveal associations between
certain group changes in variables
Develop specific hypotheses Examine associations
between two or more
variables
Make specific predictions
Qualitative research Quantitative research Quantitative research
c) Data source
Primary data Secondary data
Data collected specifically to answer the Data previously collected for purposes other
question(s) posed by the research (e.g., than the research at hand (e.g., customer
demographics) transaction databases)
Syndicated research
Large-scale marketing research that is
undertaken by a research firm and sold to
clients/companies
Lecture 2: Basic Statistical Analysis
1) Screen dataset: investigate quality of data
a) Error, missing values, inconsistencies
b) Explore and analyze the data
2) Describe and summarize data: a complete run-down analysis of all the variables in
your dataset one-at-a-time (univariate statistics)
a) Inferential analysis: learning about “the world” (univariate statistics)
b) Differential analysis (bivariate)
c) Associative analysis: (bivariate)
Descriptive analysis: used to describe the data set; frequency distributions and summary
statistics.
Inferential analysis: used to generate conclusions about the population’s characteristics
based on the sample data; confidence intervals and hypothesis testing.
3
, Differences analysis: used to compare the mean of the responses of one group to that of
another group; testing differences between samples.
Associative analysis: determines the strength and direction of relationships between two or
more variables; cross-tabulations and correlations.
Screening the dataset
- Check for missing data
o Some people miss questions in surveys
o Sometimes it is part of the research design (I don’t know)
- Find “strange codes” and errors
o Consistency checks (out of range, logically inconsistent, extreme values)
- Reverse coding (e.g., reversing negatively worded items)
Dealing with missing data
Is the missing data ignorable?
If it is part of the research design, YES. Otherwise, NO and you can:
- Assign missing values (calculating replacement values)
Or
- Delete missing values
o Exclude cases listwise: the person is excluded from the whole analysis.
o Exclude cases pairwise: a person’s data is excluded only for analyses for which
she has missing data. However, then you cannot compare analyses.
Level of measurement
Non-metric/categorical:
- Nominal
o Assigns numbers to identify subjects or objects
o Nothing is implied by the numbers other than identification
o E.g., student number, gender, region, brand chosen.
- Ordinal
o Ranking of objects
o Numbers indicate relative positions, but amount of difference between
numbers is unkown
o E.g., preference of brands or other ranking.
4