Summary Data Science in Biomedicine
Lecture 1: Introduction
Using next generation sequencing (NGS), we can sequence whole genomes very quickly, creating a lot of
data as output. These huge datasets are analyzed with programming languages like R or python. It can be
used to retrieve data from a database, apply statistical analyses, and visualize results. R is very dedicated
to statistics and very popular in research. As opposed to Excel, R data cannot be edited. Data is plotted
using the ggplot() function, which allows easy plotting of subsets, multiple graphs in 1 plot, and way more
useful functions.
Lecture 2: Statistics 1 à P-values, T-tests, and linear regression
P-value
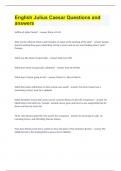
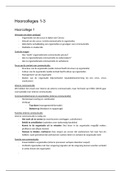
Measurements show variation. Based on the main source of the
variation, you might want to re-think your experiment. P-values
are the probabilities of an observed result. Often a cutoff of 5% is
used. However, in some cases, it is important to include the
‘impact of risk’. P-values do not tell you if it’s good or bad:
evaluate the starting point of 0.05 (ethical discussions).
- H0 (null hypothesis): thing we are trying to provide
evidence against (often something like ‘no effect’ or ‘no
difference’.
- Ha (alternative hypothesis): what we are trying to prove.
- If using a significance of p = 0.05: p < 0.05, H0 can be rejected.
T-tests
But how can we calculate the p-value? T-statistics compare data sets and tell you if they are different from
each other (e.g. a group with drug and group with placebo). There are different t-tests:
1. Independent samples: compares the means for two independent groups
a. Students from different universities
2. Paired samples: compares means from the same groups
a. Different time points (before and after)
3. One sample: test the mean of a single group against a known mean
a. Alcohol consumption of a group higher than the average
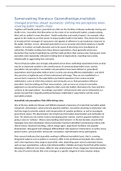
Paired T-test
If we test the same sample or patient before and after treatment: null hypothesis is
that there is no difference. We can check for a significant difference in R, using for example boxplots or
vioplots. However, it can also be done by hand, with the formula on the right. You can calculate the t-
value, and ΣD is the sum of the differences (before – after) and N is
the number of samples. When using this formula, and getting e.g.
the value of t = -2.77 (but we disregard the minus sign), we look at
the T-distribution table, use our set cutoff of 0.05, and the degrees
of freedom (which is the sample size -1). The value that is found in
the table forms the borders of the rejection zone. If the value in the
1
, table is smaller than the t-value, we can reject the null hypothesis (they are not equal). This can easily be
calculated in R.
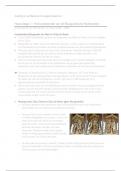
Independent T-test
If we compare the means of two sets of independent data
(categorical groups like females vs males), this test is used. The
formula is slightly more complicated (see on the right) but it still gives
a t-value. Also different numbers of samples can be used. The only
different character used is μ, which is the mean of the data set. Degrees of freedom is calculated by nA-1 +
nB-1. Using the cutoff and the degrees of freedom, we can find a value in the T-distribution table (again
forming the – and + borders of the rejection area). If the t-value lies within
these borders, the null hypothesis cannot be rejected.
Sometimes linear regression (y = ax + b) is used to predict the value of a
variable based on the value of another variable. If for example looking at
cells that double each cycle, a log base can be used (gives a straight line).
Lecture 3: Statistics 2 à outliers, permutation, FDR,
Fischer’s, Chi-squared
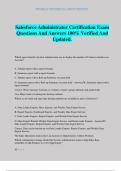
Outliers
One outlier in a (small) data set can drastically change the outcome of statistical tests (different t-value, or
different means). For t-tests, we want reliable means, and therefore we remove outliers. A universal
method for outlier detection is based on the interquartile range. Q1 is the
middle between the smallest number and the median of the data set. Q2 is
the median (literally the middle number), and Q3 is the middle number
between the largest number and the median of the data set (N-Q1+1). The
IQR = Q3 – Q1. The solution for outliers: remove all values < Q1 – 1.5*IQR,
and remove all values > Q3 + 1.5*IQR (see example).
Permutation testing
T-tests assume that the data is normally distributed. By permutation testing, you can test the distribution
of the data. For paired t-tests, we pick all our data (ignore before and after), and randomly divide this over
A and B. This is done 1000 to 10000 times, and each time the p-value is calculated. For independent
samples, the same is done (and the categories are ignored). If the original p-value was correct, we expect
that the p-values of the randomized values are higher (95% of the p-values >= the original p-value).
Multiple testing correction (FDR testing)
If a p-value is lower or equal to 0.05, there is a 95% certainty that the claim (alternative hypothesis) is true.
However, 0.05 cannot be used in every situation. Especially if there are a lot of samples (typically in
transcriptomics, genomics, and proteomics), a huge number of samples will show false positive. Therefore,
multiple testing correction is required:
2
Lecture 1: Introduction
Using next generation sequencing (NGS), we can sequence whole genomes very quickly, creating a lot of
data as output. These huge datasets are analyzed with programming languages like R or python. It can be
used to retrieve data from a database, apply statistical analyses, and visualize results. R is very dedicated
to statistics and very popular in research. As opposed to Excel, R data cannot be edited. Data is plotted
using the ggplot() function, which allows easy plotting of subsets, multiple graphs in 1 plot, and way more
useful functions.
Lecture 2: Statistics 1 à P-values, T-tests, and linear regression
P-value
Measurements show variation. Based on the main source of the
variation, you might want to re-think your experiment. P-values
are the probabilities of an observed result. Often a cutoff of 5% is
used. However, in some cases, it is important to include the
‘impact of risk’. P-values do not tell you if it’s good or bad:
evaluate the starting point of 0.05 (ethical discussions).
- H0 (null hypothesis): thing we are trying to provide
evidence against (often something like ‘no effect’ or ‘no
difference’.
- Ha (alternative hypothesis): what we are trying to prove.
- If using a significance of p = 0.05: p < 0.05, H0 can be rejected.
T-tests
But how can we calculate the p-value? T-statistics compare data sets and tell you if they are different from
each other (e.g. a group with drug and group with placebo). There are different t-tests:
1. Independent samples: compares the means for two independent groups
a. Students from different universities
2. Paired samples: compares means from the same groups
a. Different time points (before and after)
3. One sample: test the mean of a single group against a known mean
a. Alcohol consumption of a group higher than the average
Paired T-test
If we test the same sample or patient before and after treatment: null hypothesis is
that there is no difference. We can check for a significant difference in R, using for example boxplots or
vioplots. However, it can also be done by hand, with the formula on the right. You can calculate the t-
value, and ΣD is the sum of the differences (before – after) and N is
the number of samples. When using this formula, and getting e.g.
the value of t = -2.77 (but we disregard the minus sign), we look at
the T-distribution table, use our set cutoff of 0.05, and the degrees
of freedom (which is the sample size -1). The value that is found in
the table forms the borders of the rejection zone. If the value in the
1
, table is smaller than the t-value, we can reject the null hypothesis (they are not equal). This can easily be
calculated in R.
Independent T-test
If we compare the means of two sets of independent data
(categorical groups like females vs males), this test is used. The
formula is slightly more complicated (see on the right) but it still gives
a t-value. Also different numbers of samples can be used. The only
different character used is μ, which is the mean of the data set. Degrees of freedom is calculated by nA-1 +
nB-1. Using the cutoff and the degrees of freedom, we can find a value in the T-distribution table (again
forming the – and + borders of the rejection area). If the t-value lies within
these borders, the null hypothesis cannot be rejected.
Sometimes linear regression (y = ax + b) is used to predict the value of a
variable based on the value of another variable. If for example looking at
cells that double each cycle, a log base can be used (gives a straight line).
Lecture 3: Statistics 2 à outliers, permutation, FDR,
Fischer’s, Chi-squared
Outliers
One outlier in a (small) data set can drastically change the outcome of statistical tests (different t-value, or
different means). For t-tests, we want reliable means, and therefore we remove outliers. A universal
method for outlier detection is based on the interquartile range. Q1 is the
middle between the smallest number and the median of the data set. Q2 is
the median (literally the middle number), and Q3 is the middle number
between the largest number and the median of the data set (N-Q1+1). The
IQR = Q3 – Q1. The solution for outliers: remove all values < Q1 – 1.5*IQR,
and remove all values > Q3 + 1.5*IQR (see example).
Permutation testing
T-tests assume that the data is normally distributed. By permutation testing, you can test the distribution
of the data. For paired t-tests, we pick all our data (ignore before and after), and randomly divide this over
A and B. This is done 1000 to 10000 times, and each time the p-value is calculated. For independent
samples, the same is done (and the categories are ignored). If the original p-value was correct, we expect
that the p-values of the randomized values are higher (95% of the p-values >= the original p-value).
Multiple testing correction (FDR testing)
If a p-value is lower or equal to 0.05, there is a 95% certainty that the claim (alternative hypothesis) is true.
However, 0.05 cannot be used in every situation. Especially if there are a lot of samples (typically in
transcriptomics, genomics, and proteomics), a huge number of samples will show false positive. Therefore,
multiple testing correction is required:
2