1
EXERCISE 6 SUGGESTED SOLUTION
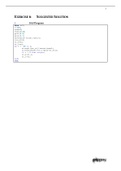
1. SAS Program
data ar2;
n=100;
seed=0;
theta0=10;
phi1=0.2;
phi2=0.7;
mu=theta0/(1-phi1-phi2);
var_at=4;
zt_2=mu;
zt_1=mu;
do t = -49 to n;
at=sqrt(var_at)*rannor(seed);
zt=theta0+phi1*zt_1+phi2*zt_2+at;
if t > 0 then output;
zt_2=zt_1;
zt_1=zt;
end;
run;
WST321
, 2
2.(a) SAS Program
goptions reset=all;
title1 'AR(2) Series Simulated - AR(1) Model Fitted';
proc arima data=ar2 out=fit_ar1 plots(only)=residuals(acf pacf);
identify var=zt nlag=6 noprint;
estimate p=1 method=ml;
forecast lead=0;
run;
data res_ar1;
set fit_ar1;
t=_n_;
run;
proc corr data=res_ar1;
var zt forecast;
run;
goptions reset=all i=join;
axis1 label=(angle=90 'Observed and Predicted Values') order = 90 to 110 by 5;
legend1 label=('Series:') value=('Observed Values' 'Predicted Values');
symbol1 color=black line=33;
symbol2 color=brown line=1;
title1 'AR(1) Model Fitted';
title2 'Time Plot of Observed and Predicted Values';
proc gplot data=res_ar1;
plot (zt forecast)*t / overlay legend=legend1 vaxis=axis1;
run;
goptions reset=all i=needle;
axis1 label=(angle=90 'Residuals') order = -10 to 10 by 1;
symbol1 color=brown;
title1 'AR(1) Model Fitted';
title2 'Plot of Residual Series';
proc gplot data=res_ar1;
plot residual*t / vaxis=axis1 vref=0;
run;
goptions reset=all;
axis1 label=(angle=90 'Residuals') order = -10 to 10 by 1;
axis2 label=('Predicted Values') order = 90 to 110 by 5;
symbol1 color=brown value=hash;
title1 'AR(1) Model Fitted';
title2 'Plot of Residuals against Predicted Values';
proc gplot data=res_ar1;
plot residual*forecast / vaxis=axis1 haxis=axis2;
run;
goptions reset=all;
title1 'AR(1) Model Fitted';
title2 'Testing for Normality';
proc univariate data=res_ar1 noprint;
histogram residual / normal (mu=est sigma=est color=brown);
probplot residual / normal (mu=est sigma=est color=brown) square;
run;
2.(a) (i) SAS Output
AR(2) Series Simulated - AR(1) Model Fitted
The ARIMA Procedure
Maximum Likelihood Estimation
Parameter Estimate Standard Error t Value Approx Lag
Pr > |t|
MU 99.55984 0.65268 152.54 <.0001 0
AR1,1 0.58347 0.08357 6.98 <.0001 1
WST321
, 3
Constant Estimate 41.46986
Variance Estimate 7.603793
Std Error Estimate 2.757498
AIC 489.0483
SBC 494.2587
Number of Residuals 100
Correlations of Parameter
Estimates
Parameter MU AR1,1
MU 1.000 -0.044
AR1,1 -0.044 1.000
The parameter estimates of the fitted AR(1) model are µˆ = 99.55984 ,
φˆ1 = 0.58347 , θˆ0 = 41.46986 and σˆ a2 = 7.603793 .
The constant and variance estimates are not close to the corresponding
parameter values ( θ 0 = 10 and σ a2 = 4 ).
The theoretical mean is
θ0
µ=
1 − φ1 − φ2
10
=
1 − 0.2 − 0.7
= 100 .
Therefore the estimate for the mean is close to the theoretical mean.
Furthermore, since p-value <.0001, H 0 : µ = 0 is rejected at a 1% level of
significance and hence µ differs significantly from zero.
The estimated autoregressive coefficient is not close to φ1 = 0.2 . But, since
H 0 : φ1 = 0 can be rejected (p-value <.0001), φ1 differs significantly from
zero. This implies that the parameter should be in the model.
The differences between the parameter values and their estimates are an
indication that the fitted model is wrongly specified.
WST321
EXERCISE 6 SUGGESTED SOLUTION
1. SAS Program
data ar2;
n=100;
seed=0;
theta0=10;
phi1=0.2;
phi2=0.7;
mu=theta0/(1-phi1-phi2);
var_at=4;
zt_2=mu;
zt_1=mu;
do t = -49 to n;
at=sqrt(var_at)*rannor(seed);
zt=theta0+phi1*zt_1+phi2*zt_2+at;
if t > 0 then output;
zt_2=zt_1;
zt_1=zt;
end;
run;
WST321
, 2
2.(a) SAS Program
goptions reset=all;
title1 'AR(2) Series Simulated - AR(1) Model Fitted';
proc arima data=ar2 out=fit_ar1 plots(only)=residuals(acf pacf);
identify var=zt nlag=6 noprint;
estimate p=1 method=ml;
forecast lead=0;
run;
data res_ar1;
set fit_ar1;
t=_n_;
run;
proc corr data=res_ar1;
var zt forecast;
run;
goptions reset=all i=join;
axis1 label=(angle=90 'Observed and Predicted Values') order = 90 to 110 by 5;
legend1 label=('Series:') value=('Observed Values' 'Predicted Values');
symbol1 color=black line=33;
symbol2 color=brown line=1;
title1 'AR(1) Model Fitted';
title2 'Time Plot of Observed and Predicted Values';
proc gplot data=res_ar1;
plot (zt forecast)*t / overlay legend=legend1 vaxis=axis1;
run;
goptions reset=all i=needle;
axis1 label=(angle=90 'Residuals') order = -10 to 10 by 1;
symbol1 color=brown;
title1 'AR(1) Model Fitted';
title2 'Plot of Residual Series';
proc gplot data=res_ar1;
plot residual*t / vaxis=axis1 vref=0;
run;
goptions reset=all;
axis1 label=(angle=90 'Residuals') order = -10 to 10 by 1;
axis2 label=('Predicted Values') order = 90 to 110 by 5;
symbol1 color=brown value=hash;
title1 'AR(1) Model Fitted';
title2 'Plot of Residuals against Predicted Values';
proc gplot data=res_ar1;
plot residual*forecast / vaxis=axis1 haxis=axis2;
run;
goptions reset=all;
title1 'AR(1) Model Fitted';
title2 'Testing for Normality';
proc univariate data=res_ar1 noprint;
histogram residual / normal (mu=est sigma=est color=brown);
probplot residual / normal (mu=est sigma=est color=brown) square;
run;
2.(a) (i) SAS Output
AR(2) Series Simulated - AR(1) Model Fitted
The ARIMA Procedure
Maximum Likelihood Estimation
Parameter Estimate Standard Error t Value Approx Lag
Pr > |t|
MU 99.55984 0.65268 152.54 <.0001 0
AR1,1 0.58347 0.08357 6.98 <.0001 1
WST321
, 3
Constant Estimate 41.46986
Variance Estimate 7.603793
Std Error Estimate 2.757498
AIC 489.0483
SBC 494.2587
Number of Residuals 100
Correlations of Parameter
Estimates
Parameter MU AR1,1
MU 1.000 -0.044
AR1,1 -0.044 1.000
The parameter estimates of the fitted AR(1) model are µˆ = 99.55984 ,
φˆ1 = 0.58347 , θˆ0 = 41.46986 and σˆ a2 = 7.603793 .
The constant and variance estimates are not close to the corresponding
parameter values ( θ 0 = 10 and σ a2 = 4 ).
The theoretical mean is
θ0
µ=
1 − φ1 − φ2
10
=
1 − 0.2 − 0.7
= 100 .
Therefore the estimate for the mean is close to the theoretical mean.
Furthermore, since p-value <.0001, H 0 : µ = 0 is rejected at a 1% level of
significance and hence µ differs significantly from zero.
The estimated autoregressive coefficient is not close to φ1 = 0.2 . But, since
H 0 : φ1 = 0 can be rejected (p-value <.0001), φ1 differs significantly from
zero. This implies that the parameter should be in the model.
The differences between the parameter values and their estimates are an
indication that the fitted model is wrongly specified.
WST321