4.3 Sales Forecasting
Sales Forecasting: Trend Analysis:
Variations from the trend:
• attempt by companies to predict • looks for underlying patterns in time series data and attempts to make
• Seasonal variations -
what levels of sales they may future predictions
products that experience
expect in future years • 2 steps to trend analysis: calculating a moving average and extrapolation
high sales volumes at
• if sales are expected to grow, certain times of the year, • the independent variable is time, and the dependent variable is whatever
then measures can be taken to is being recorded
for example ice cream.
ensure this extra demand is met. • allows for seasonal fluctuations (seasons) to be recorded
• Cyclical variations -
Measures include inventory • can also pay attention to any cyclical fluctuations (boom bust cycle)
affected by the economic
levels being expanded, and cycle. Sales of normal
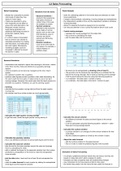
additional staff being recruited or • 3 point moving averages
goods, such as new cars
production capacity being • calculate the moving average from the sales data
and televisions, grow in
increased. • this is done by calculating the mean
recovery and boom
• If a drop in sales is forecasted, periods and fall during • plot the sales data and the trend line
then a common can choose to recessions
rationalise production by making
• Random variations -
staff redundant, and reallocating occur at any time and for
land and capital. Alternatively, any reason, for example, a
marketing budgets could be natural disaster, or
increased in attempt to prevent political unrest.
the decline in sales
Seasonal Variations:
• corporations are required to report their earnings to the stock market
every three months, these are referred to as quarterly earnings
reports.
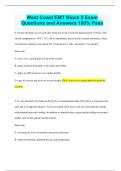
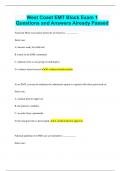
• variance analysis can be done by managers at the end of each • the trend can be extrapolated by drawing a line of best fit.
quarter • The accuracy can be improved by calculating a co-ordinate that the
• the calendar is broken into 4 quarters best fit line must go through; this is done by working out the average
• quarterly sales figures provide a problem when sales forecasting. As of all the points along the blue line using the following equations:
the year is split into four parts, it makes sense to use a four-part • x co-ordinate = the total years / number of years
moving average. However, this would mean that the trend would sit in • y co-ordinate = the total sales in the trend / number of years
between two quarters. Therefore, we use the centring system
• Centring
• calculate the four-quarter moving total and then the eight-quarter
moving total
• the number must be a whole number so round appropriately
• Calculate the eight-quarter moving average
• to get the trend, divide the eight-quarter moving total by 8 • Calculate the annual variation
• the difference between the sales and trend figures is the annual
variation
• it can be calculated using the following equation: variation = sales -
three-part moving average (trend)
• Calculate the cyclical variation
• a cyclical variation is an average of all the annual variations for that
cycle stage.
• Add the variations together an divide by the number of years
• Calculate the quarterly variation
• this is raw difference between the actual sales figure and the trend • Adjust the sales forecast
• add the cyclical variation to the sales forecast
• Calculate the seasonal variation • this is in order to make the predicted figures more accurate
• take the stat for the same quarters across the years and average
them by calculating the mean
• add or subtract the figure for the seasonal variation from the number
predicted by extrapolation of the trend to make the extrapolation Evaluation of Sales Forecasting:
more accurate
• it is simply a prediction previous trends may not reoccur but they are
• plot the data (sales, trend and line of best fit) and extrapolate the based on sales data which adds a degree of validity
trend • forecasts can help companies react by implementing changes
• make the sales forecast for each quarter by adding the extrapolated • new companies do not have previous data to draw upon
trend figure and the seasonal variation • the further they predict into the future the less useful the forecast is
Sales Forecasting: Trend Analysis:
Variations from the trend:
• attempt by companies to predict • looks for underlying patterns in time series data and attempts to make
• Seasonal variations -
what levels of sales they may future predictions
products that experience
expect in future years • 2 steps to trend analysis: calculating a moving average and extrapolation
high sales volumes at
• if sales are expected to grow, certain times of the year, • the independent variable is time, and the dependent variable is whatever
then measures can be taken to is being recorded
for example ice cream.
ensure this extra demand is met. • allows for seasonal fluctuations (seasons) to be recorded
• Cyclical variations -
Measures include inventory • can also pay attention to any cyclical fluctuations (boom bust cycle)
affected by the economic
levels being expanded, and cycle. Sales of normal
additional staff being recruited or • 3 point moving averages
goods, such as new cars
production capacity being • calculate the moving average from the sales data
and televisions, grow in
increased. • this is done by calculating the mean
recovery and boom
• If a drop in sales is forecasted, periods and fall during • plot the sales data and the trend line
then a common can choose to recessions
rationalise production by making
• Random variations -
staff redundant, and reallocating occur at any time and for
land and capital. Alternatively, any reason, for example, a
marketing budgets could be natural disaster, or
increased in attempt to prevent political unrest.
the decline in sales
Seasonal Variations:
• corporations are required to report their earnings to the stock market
every three months, these are referred to as quarterly earnings
reports.
• variance analysis can be done by managers at the end of each • the trend can be extrapolated by drawing a line of best fit.
quarter • The accuracy can be improved by calculating a co-ordinate that the
• the calendar is broken into 4 quarters best fit line must go through; this is done by working out the average
• quarterly sales figures provide a problem when sales forecasting. As of all the points along the blue line using the following equations:
the year is split into four parts, it makes sense to use a four-part • x co-ordinate = the total years / number of years
moving average. However, this would mean that the trend would sit in • y co-ordinate = the total sales in the trend / number of years
between two quarters. Therefore, we use the centring system
• Centring
• calculate the four-quarter moving total and then the eight-quarter
moving total
• the number must be a whole number so round appropriately
• Calculate the eight-quarter moving average
• to get the trend, divide the eight-quarter moving total by 8 • Calculate the annual variation
• the difference between the sales and trend figures is the annual
variation
• it can be calculated using the following equation: variation = sales -
three-part moving average (trend)
• Calculate the cyclical variation
• a cyclical variation is an average of all the annual variations for that
cycle stage.
• Add the variations together an divide by the number of years
• Calculate the quarterly variation
• this is raw difference between the actual sales figure and the trend • Adjust the sales forecast
• add the cyclical variation to the sales forecast
• Calculate the seasonal variation • this is in order to make the predicted figures more accurate
• take the stat for the same quarters across the years and average
them by calculating the mean
• add or subtract the figure for the seasonal variation from the number
predicted by extrapolation of the trend to make the extrapolation Evaluation of Sales Forecasting:
more accurate
• it is simply a prediction previous trends may not reoccur but they are
• plot the data (sales, trend and line of best fit) and extrapolate the based on sales data which adds a degree of validity
trend • forecasts can help companies react by implementing changes
• make the sales forecast for each quarter by adding the extrapolated • new companies do not have previous data to draw upon
trend figure and the seasonal variation • the further they predict into the future the less useful the forecast is