JAMAL ASSIAMAH
Introduction: In this assignment I’ll be preparing a
presentation for the calculation of the business by showing
the formulas used to calculated the ratios, and I’ll be
explaining the meaning of the ratios and what is says about
the performance of the business. I’ll be comparing the
results with the previous year and the industry average.
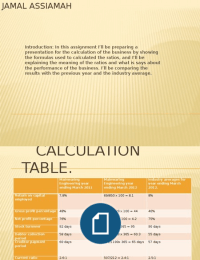
, CALCULATION
TABLE.
Mainwaring Mainwaring Industry averages for
Engineering year Engineering year year ending March
ending March 2011 ending March 2012 2012.
Return on capital 7.8% 69/850 x 100 = 8.1 8%
employed
Gross profit percentage 48% 717/1,628 x 100 = 44 40%
Net profit percentage 76% 69/1,628 x 100 = 4.2 75%
Stock turnover 92 days 237/911 x 365 = 95 90 days
Debtor collection 58 days 269/1,628 x 365 = 60.3 55 days
period
Creditor payment 60 days 212/1190x 365 = 65 days 57 days
period
Current ratio 2.6:1 507/212 = 2.4:1 2.5:1
Acid test 1.5:1 507 - 237/ 212 = 1.3:1 1.4:1
Introduction: In this assignment I’ll be preparing a
presentation for the calculation of the business by showing
the formulas used to calculated the ratios, and I’ll be
explaining the meaning of the ratios and what is says about
the performance of the business. I’ll be comparing the
results with the previous year and the industry average.
, CALCULATION
TABLE.
Mainwaring Mainwaring Industry averages for
Engineering year Engineering year year ending March
ending March 2011 ending March 2012 2012.
Return on capital 7.8% 69/850 x 100 = 8.1 8%
employed
Gross profit percentage 48% 717/1,628 x 100 = 44 40%
Net profit percentage 76% 69/1,628 x 100 = 4.2 75%
Stock turnover 92 days 237/911 x 365 = 95 90 days
Debtor collection 58 days 269/1,628 x 365 = 60.3 55 days
period
Creditor payment 60 days 212/1190x 365 = 65 days 57 days
period
Current ratio 2.6:1 507/212 = 2.4:1 2.5:1
Acid test 1.5:1 507 - 237/ 212 = 1.3:1 1.4:1