Chapter 8 – Cost volume profit analysis: (Graphs and formula’s are NB!!)
Objective of Cost-Volume-Profit analysis:
The effects of different options need to be compared to each other in the decision-
making process.
The effect that cost and volume has on profit must always be kept in mind
Management
o How many units must be sold before I break even?
This will help determine when a profit will be made
o What would be the effect on profits if I reduce my selling price and sell more
units?
o How should I pay my sales staff – fixed salary, commission or a combination
of the two?
These questions can all be answered by using cost-volume-profit analysis
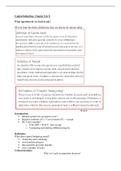
Cost-Volume-Profit graph (NB!! Will be in test- must be able to answer questions in this
graph):
, Profit
Loss
Rand
Analysis is done over the short term (< 1 year) and within the relevant range (given,
or assume that it falls within the range). The term relevant range refers to the output
range which the firm expects to be operating in the short term.
Assumption is made that the selling price, variable cost per unit and total fixed cost
remain constant
This result in a straight line/ linear/ direct relationship for total cost and revenue as
output/volume changes. The effect is that there is only one break-even point.
No profit/loss (breakeven point) is where Income = Expenses
Class notes:
The economist’s total cost line can be ignored (will not be tested on)
The total revenue line begins at 0, this is because when there are no sales, then there
will be no rand amount
The fixed cost line will remain at the same level even if the production and sales is 0.
Objective of Cost-Volume-Profit analysis:
The effects of different options need to be compared to each other in the decision-
making process.
The effect that cost and volume has on profit must always be kept in mind
Management
o How many units must be sold before I break even?
This will help determine when a profit will be made
o What would be the effect on profits if I reduce my selling price and sell more
units?
o How should I pay my sales staff – fixed salary, commission or a combination
of the two?
These questions can all be answered by using cost-volume-profit analysis
Cost-Volume-Profit graph (NB!! Will be in test- must be able to answer questions in this
graph):
, Profit
Loss
Rand
Analysis is done over the short term (< 1 year) and within the relevant range (given,
or assume that it falls within the range). The term relevant range refers to the output
range which the firm expects to be operating in the short term.
Assumption is made that the selling price, variable cost per unit and total fixed cost
remain constant
This result in a straight line/ linear/ direct relationship for total cost and revenue as
output/volume changes. The effect is that there is only one break-even point.
No profit/loss (breakeven point) is where Income = Expenses
Class notes:
The economist’s total cost line can be ignored (will not be tested on)
The total revenue line begins at 0, this is because when there are no sales, then there
will be no rand amount
The fixed cost line will remain at the same level even if the production and sales is 0.