1
Quantitative Research Methodology - ALL LECTURE NOTES
Week 1: Statistics: Covariance, Correlation And Partial Correlation Causal
Models: Spurious Relation:
Repetition 1st year – Field: Ch1: 1.8: (22-39):
Frequency distribution (histogram): how many times each score occurs.
Normal distribution: if we drew a vertical line through the center of the distribution then
it should look the same on both sides. Characterized by the bell-shaped curve.
There are two main ways in
which a distribution can deviate
from normal: (1) lack of
symmetry (called skew) and (2)
pointiness (called kurtosis).
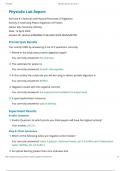
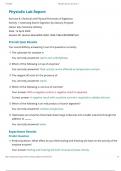
Skewed distributions are not
symmetrical and instead the
most frequent scores (the tall
bars on the graph) are clustered
at one end of the scale.
A skewed distribution can be
either positively skewed (the
frequent scores are clustered
at the lower end and the tail
points towards the higher or
more positive scores) or
negatively skewed (the
frequent scores are clustered
at the higher end and the tail points towards the lower or more negative scores).
Figure 1.4 shows examples of these distributions.
Mode: the score that occurs the most.
Median: middle score when scores are ranked in order of magnitude.
, 2
Mean: measure of central tendency, so the average score.
Range of scores: quantify the spread, or dispersion, of scores. Take the largest score
and subtract from it the smallest score.
Dispersion Metrics
Deviance: Difference between observed value of a variable and the value predicted by
the model. (difference between each score and the mean)
Total deviance: add up the deviances for each data point.
Sum of squared errors: Estimate of the total variability of a set of data (sum of
squared errors). Square deviances and add them up. Indication of total dispersion.
Standard deviation (σ or s): statistic that measures the dispersion of a dataset relative
to its mean. The standard deviation is calculated as the square root of variance by
determining each data point's deviation relative to the mean.
Variance: The average dispersion; that is, the sum of squares divided by the number of
observations minus 1.
, 3
Ch 2: 2.7, 2.9 (61-64, 72- 78):
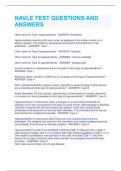
Standard Error: standard deviation of sample means. The standard error is a statistical
term that measures the accuracy with which a sample distribution represents a
population by using standard deviation. In statistics, a sample mean deviates from the
actual mean of a population; this deviation is the standard error of the mean.
Standard Error:
S (also known as σ) = standard deviation.
N = population.
Null hypothesis significance testing (NHST):
Alternative hypothesis: The hypothesis or prediction from your theory would normally
be that an effect will be present. Denoted by H1.
Null hypothesis: This hypothesis is the opposite of the alternative hypothesis and so
usually states that an effect is absent. Denoted by H0.
Hypotheses can be directional or non-directional.
● A directional hypothesis states that an effect will occur, but it also states the
direction of the effect. For example, ‘If you imagine eating chocolate you will
eat less of it’ is a one-tailed hypothesis because it states the direction of the
effect (people will eat less).
● A non-directional hypothesis states that an effect will occur, but it doesn’t
state the direction of the effect. For example, ‘Imagining eating chocolate
affects the amount of chocolate you eat’ does not tell us whether people will eat
more or less.
Confidence Interval: The range of values around a statistic that are believed to
contain, within a certain probability, the true value of that statistic.
, 4
Lower boundary interval : X̅ - (1.96 x SE).
Upper boundary interval: X̅ + (1.96 x SE).
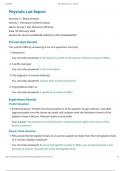
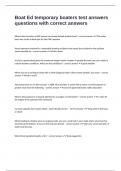
One/Two-Tailed Tests: A one-tailed test has the entire 5% of the alpha level in one
tail (in either the left, or the right tail). A two-tailed test splits your alpha level in half (as
in the image to the left). A two tailed test will have half of this (2.5%) in each tail.
P-value: Probability of obtaining test results at least as extreme as the results
actually observed, under the assumption that the null hypothesis is correct. Having
hopefully stuck to your original sampling frame and obtained the appropriate p- value,
you compare it to your original alpha value (usually 0.05). In SPSS, P value is denoted
as Sig.
● If p ≤ .01, the test is significant, there is an effect and significant
relationship. Null hypothesis can be rejected.
● If p > .01, the test is NOT significant, there is no effect and no significant
relationship. Alternative hypothesis can be rejected.
Test Statistic: used in statistical hypothesis testing. The test statistic is used to
calculate the p-value of your results, helping to decide whether to reject your null
hypothesis.
Type I error: occurs when we believe that there is a genuine effect in our population,
when in fact there isn’t one.
Type II error: occurs when we believe that there is no effect in the population when,
in reality, there is one.
Misconceptions of NHST:
Misconception 1: A significant result means that the effect is important.
Misconception 2: A non-significant result means that the null hypothesis is true.
Misconception 3: A significant result means that the null hypothesis is false.
Perhaps the biggest practical problem created by NHST is that it encourages
all-or-nothing thinking: if p < 0.05 then an effect is significant, but if p > 0.05, it is
not.
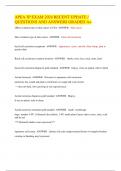
Cohen’s d: effect size used to indicate the
standardised difference between two means.
It can be used, for example, to accompany
Quantitative Research Methodology - ALL LECTURE NOTES
Week 1: Statistics: Covariance, Correlation And Partial Correlation Causal
Models: Spurious Relation:
Repetition 1st year – Field: Ch1: 1.8: (22-39):
Frequency distribution (histogram): how many times each score occurs.
Normal distribution: if we drew a vertical line through the center of the distribution then
it should look the same on both sides. Characterized by the bell-shaped curve.
There are two main ways in
which a distribution can deviate
from normal: (1) lack of
symmetry (called skew) and (2)
pointiness (called kurtosis).
Skewed distributions are not
symmetrical and instead the
most frequent scores (the tall
bars on the graph) are clustered
at one end of the scale.
A skewed distribution can be
either positively skewed (the
frequent scores are clustered
at the lower end and the tail
points towards the higher or
more positive scores) or
negatively skewed (the
frequent scores are clustered
at the higher end and the tail points towards the lower or more negative scores).
Figure 1.4 shows examples of these distributions.
Mode: the score that occurs the most.
Median: middle score when scores are ranked in order of magnitude.
, 2
Mean: measure of central tendency, so the average score.
Range of scores: quantify the spread, or dispersion, of scores. Take the largest score
and subtract from it the smallest score.
Dispersion Metrics
Deviance: Difference between observed value of a variable and the value predicted by
the model. (difference between each score and the mean)
Total deviance: add up the deviances for each data point.
Sum of squared errors: Estimate of the total variability of a set of data (sum of
squared errors). Square deviances and add them up. Indication of total dispersion.
Standard deviation (σ or s): statistic that measures the dispersion of a dataset relative
to its mean. The standard deviation is calculated as the square root of variance by
determining each data point's deviation relative to the mean.
Variance: The average dispersion; that is, the sum of squares divided by the number of
observations minus 1.
, 3
Ch 2: 2.7, 2.9 (61-64, 72- 78):
Standard Error: standard deviation of sample means. The standard error is a statistical
term that measures the accuracy with which a sample distribution represents a
population by using standard deviation. In statistics, a sample mean deviates from the
actual mean of a population; this deviation is the standard error of the mean.
Standard Error:
S (also known as σ) = standard deviation.
N = population.
Null hypothesis significance testing (NHST):
Alternative hypothesis: The hypothesis or prediction from your theory would normally
be that an effect will be present. Denoted by H1.
Null hypothesis: This hypothesis is the opposite of the alternative hypothesis and so
usually states that an effect is absent. Denoted by H0.
Hypotheses can be directional or non-directional.
● A directional hypothesis states that an effect will occur, but it also states the
direction of the effect. For example, ‘If you imagine eating chocolate you will
eat less of it’ is a one-tailed hypothesis because it states the direction of the
effect (people will eat less).
● A non-directional hypothesis states that an effect will occur, but it doesn’t
state the direction of the effect. For example, ‘Imagining eating chocolate
affects the amount of chocolate you eat’ does not tell us whether people will eat
more or less.
Confidence Interval: The range of values around a statistic that are believed to
contain, within a certain probability, the true value of that statistic.
, 4
Lower boundary interval : X̅ - (1.96 x SE).
Upper boundary interval: X̅ + (1.96 x SE).
One/Two-Tailed Tests: A one-tailed test has the entire 5% of the alpha level in one
tail (in either the left, or the right tail). A two-tailed test splits your alpha level in half (as
in the image to the left). A two tailed test will have half of this (2.5%) in each tail.
P-value: Probability of obtaining test results at least as extreme as the results
actually observed, under the assumption that the null hypothesis is correct. Having
hopefully stuck to your original sampling frame and obtained the appropriate p- value,
you compare it to your original alpha value (usually 0.05). In SPSS, P value is denoted
as Sig.
● If p ≤ .01, the test is significant, there is an effect and significant
relationship. Null hypothesis can be rejected.
● If p > .01, the test is NOT significant, there is no effect and no significant
relationship. Alternative hypothesis can be rejected.
Test Statistic: used in statistical hypothesis testing. The test statistic is used to
calculate the p-value of your results, helping to decide whether to reject your null
hypothesis.
Type I error: occurs when we believe that there is a genuine effect in our population,
when in fact there isn’t one.
Type II error: occurs when we believe that there is no effect in the population when,
in reality, there is one.
Misconceptions of NHST:
Misconception 1: A significant result means that the effect is important.
Misconception 2: A non-significant result means that the null hypothesis is true.
Misconception 3: A significant result means that the null hypothesis is false.
Perhaps the biggest practical problem created by NHST is that it encourages
all-or-nothing thinking: if p < 0.05 then an effect is significant, but if p > 0.05, it is
not.
Cohen’s d: effect size used to indicate the
standardised difference between two means.
It can be used, for example, to accompany