Multiple Choice Questions
1. A description of different houses on the market includes the following three variables: the square
footage of the house; the monthly gas bill; and the monthly electric bill. Which of the variables is
quantitative?
A) The square footage of the house.
÷
B) The monthly gas bill.
C) The monthly electric bill.
D) All of the above.
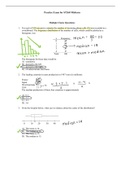
2. For each of 100 successive minutes the number of incoming phone calls (X) was recorded in a
switchboard. The frequency distribution of the number of calls, which could be plotted as a
histogram, was
x Frequency
0 33
1 38
2 18
3 8
4 3
Total 100
The histogram for these data would be
A) symmetric.
B) skewed to the left.
C) skewed to the right.
D) of indeterminate skewness.
3. The leading countries in auto production in 1987 were (in millions):
France
Japan
Germany
3.0
7.9
4.3 ④ 4.3
,
7.1 , ④
USA 7.1
The median production of these four countries is approximately
¥4.3tz = 5.7
A) 6.1
÷
B) 5.7
C) 4.3
D) 5.6
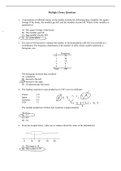
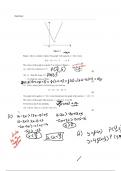
4. From the boxplot below, what can we deduce about the centre of the distribution?
__________
-------|___|______|----------------------
---|---------|----------|----------|----------|------
0 10 20 30 40
A) The mean is 14.
-
B) The median is 14.
, C) The mean is 15.
D) The median is 15.
5. Which of the following is true of the least-squares regression line?
A) The slope is the change in the response variable that would be predicted by a unit change in
the explanatory variable.
B) It always passes through the point ( x , y ) of the means of the explanatory and response
variables respectively.
C) It will only pass through all the data points if r = ±1.
D) All of the above.
6. A student wonders if people of similar heights tend to date each other. She measures herself, her
residence roommate, and the women in the adjoining rooms; then she measures the next man each
woman dates. Here are the data (heights in inches)
Women 66 64 66 65 70 65
Men 72 68 70 68 74 69
Which of the following statements is true?
A) The variables measured are all categorical.
B) There is a strong positive correlation between the heights of men and women, since the
women are always smaller than the men.
C) There is a positive correlation between the heights of men and women.
D) Correlation makes no sense here since gender is a categorical variable.
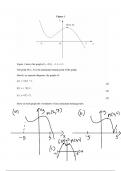
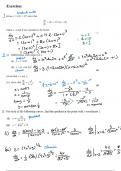
7. A researcher wishes to study how the average weight Y (in kilograms) of children changes during
the first year of life. He plots these averages versus the age X (in months) and decides to fit a
least-squares regression line to the data with X as the explanatory variable and Y as the response
variable. He computes the following quantities
Correlation between X and Y = 0.9
Mean of the values of X = 6.5
Mean of the values of Y = 6.6
Standard deviation of the values of X = 3.6
Standard deviation of the values of Y = 1.2
( ÷)
The slope of the least-squares line is
p ,=r(¥e )
=
0.9
-
A) 0.30
B) 0.88
C) 1.01 = 0.30
D) 3.0
8. Below is a scatterplot of the sales and profits (in tens of thousands of dollars) for companies
selected in a random sample from the Forbes 500 list for 1986.
1. A description of different houses on the market includes the following three variables: the square
footage of the house; the monthly gas bill; and the monthly electric bill. Which of the variables is
quantitative?
A) The square footage of the house.
÷
B) The monthly gas bill.
C) The monthly electric bill.
D) All of the above.
2. For each of 100 successive minutes the number of incoming phone calls (X) was recorded in a
switchboard. The frequency distribution of the number of calls, which could be plotted as a
histogram, was
x Frequency
0 33
1 38
2 18
3 8
4 3
Total 100
The histogram for these data would be
A) symmetric.
B) skewed to the left.
C) skewed to the right.
D) of indeterminate skewness.
3. The leading countries in auto production in 1987 were (in millions):
France
Japan
Germany
3.0
7.9
4.3 ④ 4.3
,
7.1 , ④
USA 7.1
The median production of these four countries is approximately
¥4.3tz = 5.7
A) 6.1
÷
B) 5.7
C) 4.3
D) 5.6
4. From the boxplot below, what can we deduce about the centre of the distribution?
__________
-------|___|______|----------------------
---|---------|----------|----------|----------|------
0 10 20 30 40
A) The mean is 14.
-
B) The median is 14.
, C) The mean is 15.
D) The median is 15.
5. Which of the following is true of the least-squares regression line?
A) The slope is the change in the response variable that would be predicted by a unit change in
the explanatory variable.
B) It always passes through the point ( x , y ) of the means of the explanatory and response
variables respectively.
C) It will only pass through all the data points if r = ±1.
D) All of the above.
6. A student wonders if people of similar heights tend to date each other. She measures herself, her
residence roommate, and the women in the adjoining rooms; then she measures the next man each
woman dates. Here are the data (heights in inches)
Women 66 64 66 65 70 65
Men 72 68 70 68 74 69
Which of the following statements is true?
A) The variables measured are all categorical.
B) There is a strong positive correlation between the heights of men and women, since the
women are always smaller than the men.
C) There is a positive correlation between the heights of men and women.
D) Correlation makes no sense here since gender is a categorical variable.
7. A researcher wishes to study how the average weight Y (in kilograms) of children changes during
the first year of life. He plots these averages versus the age X (in months) and decides to fit a
least-squares regression line to the data with X as the explanatory variable and Y as the response
variable. He computes the following quantities
Correlation between X and Y = 0.9
Mean of the values of X = 6.5
Mean of the values of Y = 6.6
Standard deviation of the values of X = 3.6
Standard deviation of the values of Y = 1.2
( ÷)
The slope of the least-squares line is
p ,=r(¥e )
=
0.9
-
A) 0.30
B) 0.88
C) 1.01 = 0.30
D) 3.0
8. Below is a scatterplot of the sales and profits (in tens of thousands of dollars) for companies
selected in a random sample from the Forbes 500 list for 1986.