" "" "
statistics ranch upgoteabilibijii
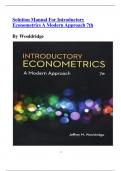
key statistical concepts
②
Population : an entire collection of individuals about which we want to draw conclusions .
②
Census : the collection of information from the whole population .
②
Sample : a subset of the population which should .
②
Survey : the collection of
information from a sample .
②
Data : information about individuals in a population .
②
Categorical variable ( qualitative) : describes a particular quality / characteristic which can be divided into categories .
②
Numerical variable ( quantitative) : describes a characteristic which has a numerical value which can be counted or measured .
Discrete numerical variable : exact number values → result of counting .
Continuous variable : values within certain result of measuring
→
a
range .
②
Parameter numerical quantity measuring aspect of the
:
a some population .
②
Statistic quantity calculated from the data gathered
:
from a sample → to estimate a
parameter .
②
Distribution the pattern of :
variation of data .
②
Outliers : data values that are either much
larger or much smaller than the
general body of data .
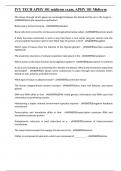
Frequency Tables
, Display of numerical data Histogram →
group variables
②
Column used to display discrete numerical variables
graphs are .
②
When data is recorded for continuous variable the data
a a
frequency histogram is used to display .
Exercise 23A
2. a. continuous variable .
b. Time 1min) Tally
0-9 1*1
10-19 1111/11*11*1
20-29 1*1111/111
30-39 111×1111
40 -49 111T I
c. positively skewed .
d. modal class : 10 -19min
Traveling time .
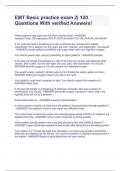
Measuring the center of data -
central tendency
Model discrete ) 1 Modal class ( continuous) : most frequently occurring value in the dataset .
Mean : statistical the arithmetic sum of all data values
name for average . mean =
the number of all data values
2 outliers use when
sy metrical
dataset present !
Median : middle value of an ordered dataset .
median = ntl
2
Exercise 2313.1
2. a. Mean dataset A : 6.46 b. Median data set A : 7 . c. The mean of dataset A is less than the mean of data set B.
Mean dataset B 6.85 : Median data set B : 7 .
since the Max value in dataset A is lower than the max value of
data set B.
d. The medians are the same for both datasets since 7- is
the middle value of the ordered dataset .
, Thursday ,
7- October
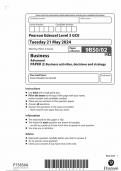
Standard Deviation 6)
On an how close are the individual values
average ,
from the mean .
Variance 104
standard deviation squared
Example :
X X -
µ (x -
Mi x x -
µ (x -
up
A. 1 1 3 5 5 µ :3 6=1.79
2 I 1
4
-
1 -
2 4
B. 2 2 3 4 µ :3 6=0.894
2 -
I 1 2 -
I 1
C. 1 2 3 4 5 µ :3 6=1.41
3 0 0 3 0 0
4 I 1 4 1 1
4 1 1 5 2 4
If = 0.894
f¥= 0.894
Exercises :
II. a. Mean
selling price : $163770 .
Median selling price : 127/600,729/500,131-400 ,
-32400,14-6400%-48000,16*00>19-2500,21+000,256-400
=
$147200 .
b. i. mean .
ii. median .
Home
12 . 21=15 List & spreadsheets → enter
3t0tatat4tat6tat3
13 .
µ=4 In A → list data points
9
InB→ list
frequency
36=3+0 tata +4+9+6 + a +3 Menu → 4( stats )
✗ = 5 4.2
16 Mean .
= median -_ 12 7- +9+111-13+14 +17+19+2/+12=12 1 Variable / 2 variable
9
n=9 21=6 =
name variables .
✗ → A
Mean Of
f- ✗
frequency distribution :
µ=
f-
statistics ranch upgoteabilibijii
key statistical concepts
②
Population : an entire collection of individuals about which we want to draw conclusions .
②
Census : the collection of information from the whole population .
②
Sample : a subset of the population which should .
②
Survey : the collection of
information from a sample .
②
Data : information about individuals in a population .
②
Categorical variable ( qualitative) : describes a particular quality / characteristic which can be divided into categories .
②
Numerical variable ( quantitative) : describes a characteristic which has a numerical value which can be counted or measured .
Discrete numerical variable : exact number values → result of counting .
Continuous variable : values within certain result of measuring
→
a
range .
②
Parameter numerical quantity measuring aspect of the
:
a some population .
②
Statistic quantity calculated from the data gathered
:
from a sample → to estimate a
parameter .
②
Distribution the pattern of :
variation of data .
②
Outliers : data values that are either much
larger or much smaller than the
general body of data .
Frequency Tables
, Display of numerical data Histogram →
group variables
②
Column used to display discrete numerical variables
graphs are .
②
When data is recorded for continuous variable the data
a a
frequency histogram is used to display .
Exercise 23A
2. a. continuous variable .
b. Time 1min) Tally
0-9 1*1
10-19 1111/11*11*1
20-29 1*1111/111
30-39 111×1111
40 -49 111T I
c. positively skewed .
d. modal class : 10 -19min
Traveling time .
Measuring the center of data -
central tendency
Model discrete ) 1 Modal class ( continuous) : most frequently occurring value in the dataset .
Mean : statistical the arithmetic sum of all data values
name for average . mean =
the number of all data values
2 outliers use when
sy metrical
dataset present !
Median : middle value of an ordered dataset .
median = ntl
2
Exercise 2313.1
2. a. Mean dataset A : 6.46 b. Median data set A : 7 . c. The mean of dataset A is less than the mean of data set B.
Mean dataset B 6.85 : Median data set B : 7 .
since the Max value in dataset A is lower than the max value of
data set B.
d. The medians are the same for both datasets since 7- is
the middle value of the ordered dataset .
, Thursday ,
7- October
Standard Deviation 6)
On an how close are the individual values
average ,
from the mean .
Variance 104
standard deviation squared
Example :
X X -
µ (x -
Mi x x -
µ (x -
up
A. 1 1 3 5 5 µ :3 6=1.79
2 I 1
4
-
1 -
2 4
B. 2 2 3 4 µ :3 6=0.894
2 -
I 1 2 -
I 1
C. 1 2 3 4 5 µ :3 6=1.41
3 0 0 3 0 0
4 I 1 4 1 1
4 1 1 5 2 4
If = 0.894
f¥= 0.894
Exercises :
II. a. Mean
selling price : $163770 .
Median selling price : 127/600,729/500,131-400 ,
-32400,14-6400%-48000,16*00>19-2500,21+000,256-400
=
$147200 .
b. i. mean .
ii. median .
Home
12 . 21=15 List & spreadsheets → enter
3t0tatat4tat6tat3
13 .
µ=4 In A → list data points
9
InB→ list
frequency
36=3+0 tata +4+9+6 + a +3 Menu → 4( stats )
✗ = 5 4.2
16 Mean .
= median -_ 12 7- +9+111-13+14 +17+19+2/+12=12 1 Variable / 2 variable
9
n=9 21=6 =
name variables .
✗ → A
Mean Of
f- ✗
frequency distribution :
µ=
f-