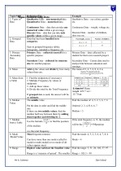
Topic/Skill Definition/Tips Data
Topic: Summarising Example
1. Types of Qualitative Data – non-numerical data Qualitative Data – eye colour, gender
Data Quantitative Data – numerical data etc.
Continuous Data – data that can take any Continuous Data – weight, voltage etc.
numerical value within a given range.
Discrete Data – data that can take only Discrete Data – number of children,
specific values within a given range. shoe size etc.
2. Grouped Data that has been bundled in to
Data categories.
Seen in grouped frequency tables,
histograms, cumulative frequency etc.
3. Primary Primary Data – collected yourself for a Primary Data – data collected by a
/Secondary specific purpose. student for their own research project.
Data
Secondary Data – collected by someone Secondary Data – Census data used to
else for another purpose. analyse link between education and
earnings.
4. Mean Add up the values and divide by how many The mean of 3, 4, 7, 6, 0, 4, 6 is
values there are. 3+4 +7+6+ 0+4 +6
=5
7
5. Mean from 1. Find the midpoints (if necessary)
a Table 2. Multiply Frequency by values or
midpoints
3. Add up these values
4. Divide this total by the Total Frequency
If grouped data is used, the answer will be
an estimate.
6. Median The middle value. Find the median of: 4, 5, 2, 3, 6, 7, 6
Value
Put the data in order and find the middle Ordered: 2, 3, 4, 5, 6, 6, 7
one.
If there are two middle values, find the Median = 5
number half way between them by adding
them together and dividing by 2.
7. Median (n+1) If the total frequency is 15, the median
Use the formula to find the position
from a Table
of the median.
2
will be the ( 15+1
2 )=8 thposition
n is the total frequency.
8. Mode Most frequent/common. Find the mode: 4, 5, 2, 3, 6, 4, 7, 8, 4
/Modal Value
Can have more than one mode (called bi- Mode = 4
modal or multi-modal) or no mode (if all
values appear once)
9. Range Highest value subtract the Smallest value Find the range: 3, 31, 26, 102, 37, 97.
Range is a ‘measure of spread’. The smaller Range = 102-3 = 99
Mr A. Coleman Glyn School
Topic: Summarising Example
1. Types of Qualitative Data – non-numerical data Qualitative Data – eye colour, gender
Data Quantitative Data – numerical data etc.
Continuous Data – data that can take any Continuous Data – weight, voltage etc.
numerical value within a given range.
Discrete Data – data that can take only Discrete Data – number of children,
specific values within a given range. shoe size etc.
2. Grouped Data that has been bundled in to
Data categories.
Seen in grouped frequency tables,
histograms, cumulative frequency etc.
3. Primary Primary Data – collected yourself for a Primary Data – data collected by a
/Secondary specific purpose. student for their own research project.
Data
Secondary Data – collected by someone Secondary Data – Census data used to
else for another purpose. analyse link between education and
earnings.
4. Mean Add up the values and divide by how many The mean of 3, 4, 7, 6, 0, 4, 6 is
values there are. 3+4 +7+6+ 0+4 +6
=5
7
5. Mean from 1. Find the midpoints (if necessary)
a Table 2. Multiply Frequency by values or
midpoints
3. Add up these values
4. Divide this total by the Total Frequency
If grouped data is used, the answer will be
an estimate.
6. Median The middle value. Find the median of: 4, 5, 2, 3, 6, 7, 6
Value
Put the data in order and find the middle Ordered: 2, 3, 4, 5, 6, 6, 7
one.
If there are two middle values, find the Median = 5
number half way between them by adding
them together and dividing by 2.
7. Median (n+1) If the total frequency is 15, the median
Use the formula to find the position
from a Table
of the median.
2
will be the ( 15+1
2 )=8 thposition
n is the total frequency.
8. Mode Most frequent/common. Find the mode: 4, 5, 2, 3, 6, 4, 7, 8, 4
/Modal Value
Can have more than one mode (called bi- Mode = 4
modal or multi-modal) or no mode (if all
values appear once)
9. Range Highest value subtract the Smallest value Find the range: 3, 31, 26, 102, 37, 97.
Range is a ‘measure of spread’. The smaller Range = 102-3 = 99
Mr A. Coleman Glyn School