Diverse places and spaces
4.1a UK’s uneven population growth
The UK has had an uneven growing population since the 1900s due to positive net migration and
natural increase (200,000).
● These young migrants are fertile with cultural values e.g. against contraception or want a
larger family. This will help further increase the fertility rate.
● There has been a lifestyle and diet change, as well as medicine availability e.g. nhs and focus
on communicable disease. This increased life expectancy producing an ageing population and
elderly dependence (especially for females).
● Immigration recently caused this growth e.g. 2004 A8 countries. This will continue as
globalisation reduces obstacles.
● Migration fuels growth 10 times more than the natural increase, areas like Scotland would be
in decline without migration.
This is the North-South drift and was at its peak in the 80s and 90s following deindustrialization as a
result of the Global Shift. This is a type of core-periphery relationship where the South is the core and
the North is the periphery.
Population growth varies throughout the UK, the North has experienced little growth in contrast to the
South due to:
● The rising prosperity of SE Englandwhich has become a hub of modern service industries.
● They have experienced rapid population growth due to London’s rising role as an expanding
knowledge economy. This has led to a rise in internal migration and international migration to
London, particularly of high-skilled graduates.
● Decline of manufacturing industriesin areas e.g. coal industries in North of England, due to
foreign competition and technological advances. Deindustrialisation means they migrate south
to economic hubs.
● The 10 English areas with the slowest projected population growth are all in the North
West/East.
● Meanwhile the South has England’s average population growth is 7% whereas London’s is
13%. 8 of the 10 fastest growing areas are in London.
Population density is lowest in the North and higher in the South, especially near London. This is
mostly due to economic geography as explained. Distance from the economic cores decreases
population density, e.g. Cornwall and Scotland. Physical geography also has an impact e.g. Wales and
Scotland are mountainous and don't have the best climate, so fewer people are able to live there. Thus
England has over 80% of the UK population but only 50% of the UK area.
4.1 Why UK population structure and density varies
Factors affecting population density:
● Physical environment, fairly flat land is easier and cheaper to build on than
steep slopes and food plains.
● Socio-economic status, more wealthy members of societylive in more expensive
housing, typically in areas with a low population and housing density because
the housing and environment is nicer.
● Dwelling type and household size, lots of flats ina certain area and also having
lots of people living in one house.
● Functions, function of activities placed nearby directlyand indirectly affects
population density. Activities like parks or shops remove housing space.
Activities like jobs affect housing demands nearby, e.g. manufacturing creates
cheaper, smaller housing nearby.
● Planning, e.g. green belt land. Also planning consent issued by the local government for how
many units are to be built as well as deciding the location of non-residential activities.
● Historical development e.g. a mining town attracting immigrants thus has a young population.
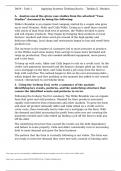
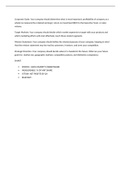
,Population pyramids:
Older dependents (65+)
Economically active, sustaining the two
‘dependent groups’ (15-64)
Younger dependents (0-14)
They are in stage four (low stationary) of
the demographic transition model as death
rate is lower and so is birth rate.
Factors influencing structure:
Changing fertility and mortality
Demographic change is caused by changes to the fertility and mortality rate:
● The fertility rate is falling along with increased prosperity over time: as women are more likely
to have a long term career, marry later, have contraception access, divorse rates are higher
and due to cultural changes of the ideal family size.
● The mortality rate falls as increased health care, immunisation and treatment of diseases like
cancer in conjunction with improved living standards and sanitisation increases life
expectancy.
These two factors combined leads to a higher dependency ratio as it leads to a falling economically
active population. This is seen in the UK where in the last 30 years old dependents increased by 40%.
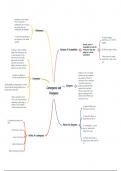
The rural-urban continuum
As you move further away from cities, the landscape becomes increasingly rural. However, the terms
‘rural’ and ‘urban’ are not absolute, and there is no beginning and end to urban and rural areas. The
rural urban continuum diagram represents this spectrum.
● Urban areas have high proportions of young adults, due to job opportunities,
young migrants and service options. There are normally thus high fertility rates
and population growth. Mortality rates are shaped by the high stress lifestyle
but better health care means life expectancy is increasing.
● Rural areas have higher mortality rates as they tend to be home to more retired
citizens. Furthermore, due to the young internally migrating away for advancement
to urban areas and little international migration the fertility rate is very low. The
increasing life expectancy is creating a large ageing population.
However areas far away in distance are closer in terms of how similar the societes and landscape are
due to advancing transport routes allowing for migration and people to settle in these areas. As well
as this, two areas the same distance from a major city could have different levels of urbanisation –
showing that it is not necessarily true that as you get further away from a major city it becomes
universally more rural.However due to counter-urbanisation there are increasingly populations of
young adults living in rural areas/on the fringe, who then commute into work.
Migration
Large refugee and economic migration internationally has resulted in an increasingly fertile
economically active population. Urban areas normally have a more positive net migration, with cultural
clustering occurring in cities. The UK as a whole has seen a doubling in net international migration in
the last 20 years e.g. their largest source of migration is from India and Poland, both 9% share. This
helps to balance the ageing population structure of the UK.
Migration increase has mainly been due to political alliances, lower price of long-distance travel,
conflict and increased employment opportunities.
, 4.2/3 Local v contrasting places
URBAN NORTH WEST LONDON VS RURAL NORTH LAKES
Urban north west London is in South East England (Brent and Camden) whilst rural north Lakes,
Allerdale (Kewick and Workington) is in the North East of England (lake district region).
Population:
● North west London has a varying fertility rate of 1.1 in prominent areas like Camden and 1.7 in
Brent. The mortality rate is also low with life expectancy being 81 in both Brent and Camden,
this is higher than the UK average. The average age is young at 37, only 12% are pensioners.
However Brent is over 1.5 times more densely populated than Camden.
● North Lakes has a low fertility rate of 1.2. Themortality rate is low with life expectancy being
77 years, below the UK average. The average age is old at 49 in Allerdale, compared to
England’s 40. It is not densely populated.
Cultural:
● North west london is culturally diverse and this is also seen in the built environment e.g. ethnic
restaurants. Areas such as Camden’s population is 35% ethnic and 66% white in comparison
to the UK’s 9% ethnic. However areas like Brent are 44% ethnic and 36% white. This shows
ethnicity varies across NW london. Brent is home to more ethnic clusters with 4 ethnicities
having over 10% of the population whilst Camden has 1.
● North Lakes is not culturally diverse and mainly contains a typical English environment. They
are only 3% of ethnic backgrounds and mainly white, this isconsistent across the area.
Inequality:
● North west London is extremely unequal with areas like Brent containing the top 10% of
deprived households and Camden the bottom 10% of deprived households. This disparity can
be seen across the board e.g. education levels. Although overall they have lower deprivation
overall in London.
● North lakes is very equal, with areas such as Workington and Keswick all being around the
40% most deprived households. Furthermore education and health levels are even across the
region. However Keswick due to better opportunities in natural gas has higher wealth.
Employment is 14% lower than in nw london.
Regional influences:
● House prices- When cheap then any migrants (international or internal). If it’s international
migrants of certain ethnicities (e.g. post- war/post-colonial migration) this will create
clusterings e.g. Brent attracted a lot of Indian migrants due to its low house prices. This alters
local amenities as they change to meet more ethnic-oriented demands e.g. Indian food shops.
Furthermore the variety of house prices encourages inequality in nw london and sees larger
disparities between areas. Cheap housing also encourages younger individuals.
● Job opportunities- if there are a range of jobs availablein an area with higher wages on offer
(an economic core) it attracts more migrants (international and internal) altering cultural
characteristics and population density, e.g. London provides massive employment
opportunities. The type of job offered attracts different migrants and also creates a more
young fertile population. North Lakes thus has more pensioners, not economically active
creating larger deprivation.
● Planning- If there is a lot of natural landscapesand parks the government prevents
development on the area creating a lower density population and attracting older people to
the beautiful area e.g. North lakes have multiple natural park status. Also creating a lack of
attraction for migrants and the young due to a lack of new housing. Whereas high rise flats
were encouraged in Brent to increase space for workers.
● Accessibility- North Lakes is distant and hard to access especially traditionally for migrants
when cars did not exist in comparison to London with a large transport network creating
migration access and a larger population.
4.1a UK’s uneven population growth
The UK has had an uneven growing population since the 1900s due to positive net migration and
natural increase (200,000).
● These young migrants are fertile with cultural values e.g. against contraception or want a
larger family. This will help further increase the fertility rate.
● There has been a lifestyle and diet change, as well as medicine availability e.g. nhs and focus
on communicable disease. This increased life expectancy producing an ageing population and
elderly dependence (especially for females).
● Immigration recently caused this growth e.g. 2004 A8 countries. This will continue as
globalisation reduces obstacles.
● Migration fuels growth 10 times more than the natural increase, areas like Scotland would be
in decline without migration.
This is the North-South drift and was at its peak in the 80s and 90s following deindustrialization as a
result of the Global Shift. This is a type of core-periphery relationship where the South is the core and
the North is the periphery.
Population growth varies throughout the UK, the North has experienced little growth in contrast to the
South due to:
● The rising prosperity of SE Englandwhich has become a hub of modern service industries.
● They have experienced rapid population growth due to London’s rising role as an expanding
knowledge economy. This has led to a rise in internal migration and international migration to
London, particularly of high-skilled graduates.
● Decline of manufacturing industriesin areas e.g. coal industries in North of England, due to
foreign competition and technological advances. Deindustrialisation means they migrate south
to economic hubs.
● The 10 English areas with the slowest projected population growth are all in the North
West/East.
● Meanwhile the South has England’s average population growth is 7% whereas London’s is
13%. 8 of the 10 fastest growing areas are in London.
Population density is lowest in the North and higher in the South, especially near London. This is
mostly due to economic geography as explained. Distance from the economic cores decreases
population density, e.g. Cornwall and Scotland. Physical geography also has an impact e.g. Wales and
Scotland are mountainous and don't have the best climate, so fewer people are able to live there. Thus
England has over 80% of the UK population but only 50% of the UK area.
4.1 Why UK population structure and density varies
Factors affecting population density:
● Physical environment, fairly flat land is easier and cheaper to build on than
steep slopes and food plains.
● Socio-economic status, more wealthy members of societylive in more expensive
housing, typically in areas with a low population and housing density because
the housing and environment is nicer.
● Dwelling type and household size, lots of flats ina certain area and also having
lots of people living in one house.
● Functions, function of activities placed nearby directlyand indirectly affects
population density. Activities like parks or shops remove housing space.
Activities like jobs affect housing demands nearby, e.g. manufacturing creates
cheaper, smaller housing nearby.
● Planning, e.g. green belt land. Also planning consent issued by the local government for how
many units are to be built as well as deciding the location of non-residential activities.
● Historical development e.g. a mining town attracting immigrants thus has a young population.
,Population pyramids:
Older dependents (65+)
Economically active, sustaining the two
‘dependent groups’ (15-64)
Younger dependents (0-14)
They are in stage four (low stationary) of
the demographic transition model as death
rate is lower and so is birth rate.
Factors influencing structure:
Changing fertility and mortality
Demographic change is caused by changes to the fertility and mortality rate:
● The fertility rate is falling along with increased prosperity over time: as women are more likely
to have a long term career, marry later, have contraception access, divorse rates are higher
and due to cultural changes of the ideal family size.
● The mortality rate falls as increased health care, immunisation and treatment of diseases like
cancer in conjunction with improved living standards and sanitisation increases life
expectancy.
These two factors combined leads to a higher dependency ratio as it leads to a falling economically
active population. This is seen in the UK where in the last 30 years old dependents increased by 40%.
The rural-urban continuum
As you move further away from cities, the landscape becomes increasingly rural. However, the terms
‘rural’ and ‘urban’ are not absolute, and there is no beginning and end to urban and rural areas. The
rural urban continuum diagram represents this spectrum.
● Urban areas have high proportions of young adults, due to job opportunities,
young migrants and service options. There are normally thus high fertility rates
and population growth. Mortality rates are shaped by the high stress lifestyle
but better health care means life expectancy is increasing.
● Rural areas have higher mortality rates as they tend to be home to more retired
citizens. Furthermore, due to the young internally migrating away for advancement
to urban areas and little international migration the fertility rate is very low. The
increasing life expectancy is creating a large ageing population.
However areas far away in distance are closer in terms of how similar the societes and landscape are
due to advancing transport routes allowing for migration and people to settle in these areas. As well
as this, two areas the same distance from a major city could have different levels of urbanisation –
showing that it is not necessarily true that as you get further away from a major city it becomes
universally more rural.However due to counter-urbanisation there are increasingly populations of
young adults living in rural areas/on the fringe, who then commute into work.
Migration
Large refugee and economic migration internationally has resulted in an increasingly fertile
economically active population. Urban areas normally have a more positive net migration, with cultural
clustering occurring in cities. The UK as a whole has seen a doubling in net international migration in
the last 20 years e.g. their largest source of migration is from India and Poland, both 9% share. This
helps to balance the ageing population structure of the UK.
Migration increase has mainly been due to political alliances, lower price of long-distance travel,
conflict and increased employment opportunities.
, 4.2/3 Local v contrasting places
URBAN NORTH WEST LONDON VS RURAL NORTH LAKES
Urban north west London is in South East England (Brent and Camden) whilst rural north Lakes,
Allerdale (Kewick and Workington) is in the North East of England (lake district region).
Population:
● North west London has a varying fertility rate of 1.1 in prominent areas like Camden and 1.7 in
Brent. The mortality rate is also low with life expectancy being 81 in both Brent and Camden,
this is higher than the UK average. The average age is young at 37, only 12% are pensioners.
However Brent is over 1.5 times more densely populated than Camden.
● North Lakes has a low fertility rate of 1.2. Themortality rate is low with life expectancy being
77 years, below the UK average. The average age is old at 49 in Allerdale, compared to
England’s 40. It is not densely populated.
Cultural:
● North west london is culturally diverse and this is also seen in the built environment e.g. ethnic
restaurants. Areas such as Camden’s population is 35% ethnic and 66% white in comparison
to the UK’s 9% ethnic. However areas like Brent are 44% ethnic and 36% white. This shows
ethnicity varies across NW london. Brent is home to more ethnic clusters with 4 ethnicities
having over 10% of the population whilst Camden has 1.
● North Lakes is not culturally diverse and mainly contains a typical English environment. They
are only 3% of ethnic backgrounds and mainly white, this isconsistent across the area.
Inequality:
● North west London is extremely unequal with areas like Brent containing the top 10% of
deprived households and Camden the bottom 10% of deprived households. This disparity can
be seen across the board e.g. education levels. Although overall they have lower deprivation
overall in London.
● North lakes is very equal, with areas such as Workington and Keswick all being around the
40% most deprived households. Furthermore education and health levels are even across the
region. However Keswick due to better opportunities in natural gas has higher wealth.
Employment is 14% lower than in nw london.
Regional influences:
● House prices- When cheap then any migrants (international or internal). If it’s international
migrants of certain ethnicities (e.g. post- war/post-colonial migration) this will create
clusterings e.g. Brent attracted a lot of Indian migrants due to its low house prices. This alters
local amenities as they change to meet more ethnic-oriented demands e.g. Indian food shops.
Furthermore the variety of house prices encourages inequality in nw london and sees larger
disparities between areas. Cheap housing also encourages younger individuals.
● Job opportunities- if there are a range of jobs availablein an area with higher wages on offer
(an economic core) it attracts more migrants (international and internal) altering cultural
characteristics and population density, e.g. London provides massive employment
opportunities. The type of job offered attracts different migrants and also creates a more
young fertile population. North Lakes thus has more pensioners, not economically active
creating larger deprivation.
● Planning- If there is a lot of natural landscapesand parks the government prevents
development on the area creating a lower density population and attracting older people to
the beautiful area e.g. North lakes have multiple natural park status. Also creating a lack of
attraction for migrants and the young due to a lack of new housing. Whereas high rise flats
were encouraged in Brent to increase space for workers.
● Accessibility- North Lakes is distant and hard to access especially traditionally for migrants
when cars did not exist in comparison to London with a large transport network creating
migration access and a larger population.