MACROECONOMICS
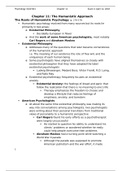
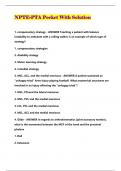
CIRCULAR FLOW OF INCOME MODEL
GOODS AND SERVICES
CONSUMER EXPENDITURE
WAGES, RENT AND DIVIDENDS
FACTORS OF PRODUCTION
Money travels around the economy between firms and households. In exchange for wages, rent
and dividends households provide firms with the factors of production. In exchange for goods
and services households provide firms with their consumer expenditure.
On top of this, there are withdrawals and injections out of, and into, the economy.
INJECTIONS WITHDRAWALS
Saving S Investment I
Taxation T Gov Spending G
Imports M Exports X
AGREGGATE DEMAND AND AGGREGATE SUPPLY
AGGREGATE DEMAND
Aggregate demand is the total amount of planned spending on goods and services at a given
price level in an economy in a year.
AD is the sum of the following components:
- Consumption (C)
- Investment (I)
- Government Expenditure (G)
- Trade Balance (X – M)
AD = C + I + G + (X – M)
Each component has relative importance, with consumption comprising about 60% of the UK
economy. Government expenditure usually comprises around 25% of AD, although this
, changes due to circumstance (Covid 19 and the 2008 Financial Crisis being good examples).
Investment equates to around 15% of UK AD, whilst net trade is fairly insignificant.
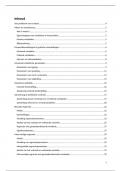
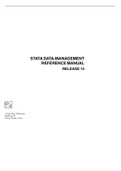
THE AD CURVE
The AD curve is downwards sloping. This is because…
- The real balance effect means that when the price level rises, the purchasing power
of cash assets fall, resulting in a decrease in the demand for real output
- The international trade effect means that a rise in the price level (relative to other
countries) causes a decrease in the competitiveness of the UK economy, so causing a
decrease in demand for exports and an increase in demand for imports.
- The interest rate effect means that, assuming there is a constant money supply, a
higher price level results in an increased demand for money. As a result, interest rates
rise, reducing consumption and investments as so causing a contraction in AD.
A movement along an AD curve is caused by a change in the price level. For example, a
decrease in oil prices will result in an expansion of AD because the costs of production have
decreased, so supply will increase and there will be more demand for goods which are now
cheaper.
AD shifts when any of its components change (C, I, G, X and M). The size of the change
depends on the degree of change of the component as well as on the multiplier effect.
If demand increases, the AD curve will shift to the right.
If demand decreases, the AD curve will shift to the left.
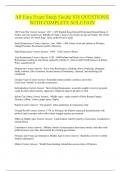
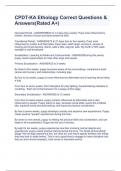
AGGREGATE SUPPLY
Aggregate supply is the total amount of goods and services that firms are willing to supply at a
given price level in an economy in a year.
The short run aggregate supply curve is based on the costs of production, and incorporates
rent, wages, interest and profit.
It is upwards sloping from left to right, indicating that when the price level increases, firms in
the economy are willing to supply more.
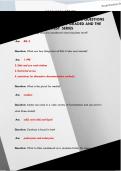
Alternatively, the SRAS curve may be drawn with a horizontal section where there is spare
capacity, an upwards section where there are bottlenecks in the economy, and a vertical part
representing full employment. This is the Keynesian AS curve.
The Keynesian SRAS curve can show that as the price level rises firms are generally willing to
supply more but there comes a point where firms reach maximum capacity.
CIRCULAR FLOW OF INCOME MODEL
GOODS AND SERVICES
CONSUMER EXPENDITURE
WAGES, RENT AND DIVIDENDS
FACTORS OF PRODUCTION
Money travels around the economy between firms and households. In exchange for wages, rent
and dividends households provide firms with the factors of production. In exchange for goods
and services households provide firms with their consumer expenditure.
On top of this, there are withdrawals and injections out of, and into, the economy.
INJECTIONS WITHDRAWALS
Saving S Investment I
Taxation T Gov Spending G
Imports M Exports X
AGREGGATE DEMAND AND AGGREGATE SUPPLY
AGGREGATE DEMAND
Aggregate demand is the total amount of planned spending on goods and services at a given
price level in an economy in a year.
AD is the sum of the following components:
- Consumption (C)
- Investment (I)
- Government Expenditure (G)
- Trade Balance (X – M)
AD = C + I + G + (X – M)
Each component has relative importance, with consumption comprising about 60% of the UK
economy. Government expenditure usually comprises around 25% of AD, although this
, changes due to circumstance (Covid 19 and the 2008 Financial Crisis being good examples).
Investment equates to around 15% of UK AD, whilst net trade is fairly insignificant.
THE AD CURVE
The AD curve is downwards sloping. This is because…
- The real balance effect means that when the price level rises, the purchasing power
of cash assets fall, resulting in a decrease in the demand for real output
- The international trade effect means that a rise in the price level (relative to other
countries) causes a decrease in the competitiveness of the UK economy, so causing a
decrease in demand for exports and an increase in demand for imports.
- The interest rate effect means that, assuming there is a constant money supply, a
higher price level results in an increased demand for money. As a result, interest rates
rise, reducing consumption and investments as so causing a contraction in AD.
A movement along an AD curve is caused by a change in the price level. For example, a
decrease in oil prices will result in an expansion of AD because the costs of production have
decreased, so supply will increase and there will be more demand for goods which are now
cheaper.
AD shifts when any of its components change (C, I, G, X and M). The size of the change
depends on the degree of change of the component as well as on the multiplier effect.
If demand increases, the AD curve will shift to the right.
If demand decreases, the AD curve will shift to the left.
AGGREGATE SUPPLY
Aggregate supply is the total amount of goods and services that firms are willing to supply at a
given price level in an economy in a year.
The short run aggregate supply curve is based on the costs of production, and incorporates
rent, wages, interest and profit.
It is upwards sloping from left to right, indicating that when the price level increases, firms in
the economy are willing to supply more.
Alternatively, the SRAS curve may be drawn with a horizontal section where there is spare
capacity, an upwards section where there are bottlenecks in the economy, and a vertical part
representing full employment. This is the Keynesian AS curve.
The Keynesian SRAS curve can show that as the price level rises firms are generally willing to
supply more but there comes a point where firms reach maximum capacity.