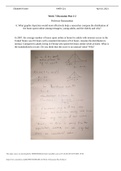
Elizabeth Frazier MATH 221 Apri 16, 2021
Week 7 Discussion Post # 2
Professor Ramanathan
6. What graphic depiction would most effectively help a researcher compare the distribution of
the hours spent online among teenagers, young adults, and the elderly and why?
In 2007, the average number of hours spent online at home for adults with internet access in the
United States was 8.9 hours with a standard deviation of 0.4 hours. Assume the distribution is
normal. Compared to adults living in Florida who spend 8.0 hours online while at home. What is
the standardized (z) score. Do you think that this score is an unusual value? Why?
This study source was downloaded by 100000849840424 from CourseHero.com on 07-20-2022 09:36:39 GMT -05:00
https://www.coursehero.com/file/89083102/MATH-221-Week-7-Discussion-Post-N-2docx/