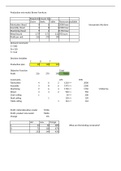
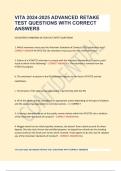
Production mix model: Brown Furniture
Requirements per hour
Chairs Desks Tables Resources available
Fabrication (hour) 4 6 2 2000 hour Incorporate the demand constraints
Assembly (hour) 3 8 6 2200 hour
Machining (hour) 9 6 4 1750 hour
Wood (sq m) 2.79 3.71 2.32 950 sq m
Profit per unit 216 270 190
Demand constraint:
C<=300
D<=120
T<=144
Decision Variables
C D T
Production plan 50 120 144
Objective Function Total
Profit 216 270 190 70656
Constraints LHS RHS
Fabrication 4 6 2 1210 <= 2000
Assembly 3 8 6 1975 <= 2200
Machining 9 6 4 1750 <= 1750 1.What happens to the le
Wood 3 4 2 920 <= 950
Chair ceiling 1 50 <= 300
Desk ceiling 1 120 <= 120
Table ceiling 1 144 <= 144
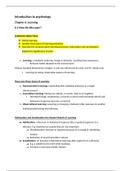
Profit: initial allocation model 74936
Profit: product mix model 70656
Change -6%
old new change
C 34 50 48% What are the binding constraints?
D 72 120 67%
T 253 144 -43%
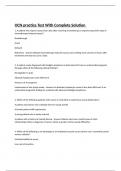
Requirements per hour
Chairs Desks Tables Resources available
Fabrication (hour) 4 6 2 2000 hour Incorporate the demand constraints
Assembly (hour) 3 8 6 2200 hour
Machining (hour) 9 6 4 1750 hour
Wood (sq m) 2.79 3.71 2.32 950 sq m
Profit per unit 216 270 190
Demand constraint:
C<=300
D<=120
T<=144
Decision Variables
C D T
Production plan 50 120 144
Objective Function Total
Profit 216 270 190 70656
Constraints LHS RHS
Fabrication 4 6 2 1210 <= 2000
Assembly 3 8 6 1975 <= 2200
Machining 9 6 4 1750 <= 1750 1.What happens to the le
Wood 3 4 2 920 <= 950
Chair ceiling 1 50 <= 300
Desk ceiling 1 120 <= 120
Table ceiling 1 144 <= 144
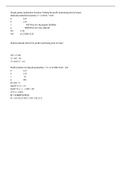
Profit: initial allocation model 74936
Profit: product mix model 70656
Change -6%
old new change
C 34 50 48% What are the binding constraints?
D 72 120 67%
T 253 144 -43%