Reporting:
- Percentages: one decimal; p-values three decimals; any other: two
decimals
- Check the italic (P, sd, t, f)
- When a p value is below .001, report it in the following manner: p < .001.
Table of Contents
Bivariate analysis: analysis of two variables............................................................................2
PEARSON’S CHI SQUARE........................................................................................................................ 2
PEARSON’S R............................................................................................................................................. 4
Compare Means - t-test......................................................................................................................9
Independent sample t-test................................................................................................................... 9
Dependent (paired) sample t-test................................................................................................... 11
One sample t-test.................................................................................................................................. 12
One -way Anova.................................................................................................................................13
Factorial Anova..................................................................................................................................15
Simple regression analysis............................................................................................................18
Multiple regression..........................................................................................................................21
CREATING DUMMY VARIABLES.....................................................................................................24
INTERACTION BETWEEN TWO VARIABLES..............................................................................25
Factor analysis...................................................................................................................................27
, Bivariate analysis: analysis of two variables
Step 1: Define measurement level
Step 2: Define whether the relationship is symmetric or asymmetric
- Symmetric: no dependent variable
- Merely association
- We don’t know whether variable A affects variable B or whether B
affects A but we know that A and B tend to go together.
- Asymmetric: independent and dependent variable
- One variable affects the other variable
- The independent variable affects the dependent variable
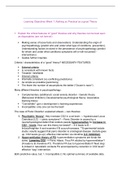
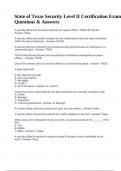
Step 3: Choose the right test of significance and its associated effect size
PEARSON’S CHI SQUARE
Since we have two categorical variables, we should in this case run Pearson’s chi
square followed by _____ test of association.
NOMINAL ORDINAL VARIABLES (IS THERE A RELATIONSHIP BTW TWO
CATEGORICAL VARIABLES)
Null hypothesis that there is no association between [variable1] and [variable2] in
the population.
ASSUMPTIONS
- At least 80% of cells of the contingency table have an expected frequency
(expected count) of 5;
- No cells (0%) have an expected frequency of 0;
- The contingency table has at least 3 columns or 3 rows.
(IF NO LOOK AT FISHER EXACT)**
“0 cells (0.0%) have expected count less than 5. The minimum expected count is
11.60,” so these conditions are met. Furthermore, since this is a 4-by-2 table, we
satisfy the condition relative to the minimum number of columns or rows as well.”
If assumptions are met: run the chi-square:
To run a Chi-square analysis (CHECK ASSUMPTIONS)
- Analyse
- Descriptive Statistics
- Crosstabs
- Insert
- Independent variable in the columns
- Dependent variable in the rows
- Then you check the
- Cells: Counts – click “observed” and “expected”
Percentage – click “columns”
- Statistics: Click “Chi-square” and select the appropriate test (see
table below), “Goodman & Kruskall’sTau” = “lambda”.
- Then Paste
- Percentages: one decimal; p-values three decimals; any other: two
decimals
- Check the italic (P, sd, t, f)
- When a p value is below .001, report it in the following manner: p < .001.
Table of Contents
Bivariate analysis: analysis of two variables............................................................................2
PEARSON’S CHI SQUARE........................................................................................................................ 2
PEARSON’S R............................................................................................................................................. 4
Compare Means - t-test......................................................................................................................9
Independent sample t-test................................................................................................................... 9
Dependent (paired) sample t-test................................................................................................... 11
One sample t-test.................................................................................................................................. 12
One -way Anova.................................................................................................................................13
Factorial Anova..................................................................................................................................15
Simple regression analysis............................................................................................................18
Multiple regression..........................................................................................................................21
CREATING DUMMY VARIABLES.....................................................................................................24
INTERACTION BETWEEN TWO VARIABLES..............................................................................25
Factor analysis...................................................................................................................................27
, Bivariate analysis: analysis of two variables
Step 1: Define measurement level
Step 2: Define whether the relationship is symmetric or asymmetric
- Symmetric: no dependent variable
- Merely association
- We don’t know whether variable A affects variable B or whether B
affects A but we know that A and B tend to go together.
- Asymmetric: independent and dependent variable
- One variable affects the other variable
- The independent variable affects the dependent variable
Step 3: Choose the right test of significance and its associated effect size
PEARSON’S CHI SQUARE
Since we have two categorical variables, we should in this case run Pearson’s chi
square followed by _____ test of association.
NOMINAL ORDINAL VARIABLES (IS THERE A RELATIONSHIP BTW TWO
CATEGORICAL VARIABLES)
Null hypothesis that there is no association between [variable1] and [variable2] in
the population.
ASSUMPTIONS
- At least 80% of cells of the contingency table have an expected frequency
(expected count) of 5;
- No cells (0%) have an expected frequency of 0;
- The contingency table has at least 3 columns or 3 rows.
(IF NO LOOK AT FISHER EXACT)**
“0 cells (0.0%) have expected count less than 5. The minimum expected count is
11.60,” so these conditions are met. Furthermore, since this is a 4-by-2 table, we
satisfy the condition relative to the minimum number of columns or rows as well.”
If assumptions are met: run the chi-square:
To run a Chi-square analysis (CHECK ASSUMPTIONS)
- Analyse
- Descriptive Statistics
- Crosstabs
- Insert
- Independent variable in the columns
- Dependent variable in the rows
- Then you check the
- Cells: Counts – click “observed” and “expected”
Percentage – click “columns”
- Statistics: Click “Chi-square” and select the appropriate test (see
table below), “Goodman & Kruskall’sTau” = “lambda”.
- Then Paste