1
Summary: Experimental Research Methods
Lecture 1: Introduction (Ch. 4, 5.6-5.9, 6-8, 12)
Experimental research methods -> techniques that show us how to
analyse experimental data
Descriptive Statistics
= summarize data
Data = numerical inform. of a population or sample
help summarize data -> list of raw data is unclear
two ways to summarize data: distribution or sample statistics
Distribution
data summarized by grouping data with the same score
this can be done in frequency distribution table or histogram
SPSS syntax to generate frequency distribution and histograms (syntax important
exam)
Sample statistics
Data summarized using characteristic features of the distribution
What are characteristic features of a distribution?
1. Most characteristic score of a distribution = central tendency
2. How much do scores deviate from the most characteristic score = dispersion
(variance)
Central tendency
Measures of central tendency are mean, median and mode
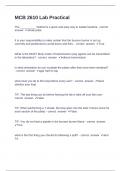
Mean of the data is the sum of all scores divided by the total number of scores
By hand:
, 2
Dispersion
Measures of dispersion are range, variance and the standard deviation
Variance of data is the sum of all squared deviance scores divided by the number of
scores minus one
𝑠 = , square root of variance = standard deviation, √𝑠
Inferential statistics
Descriptive statistics suffices if we have data of the entire population
Almost always we only have data of a sample & not the population, because:
1. Too expensive
2. Takes too long to collect these data
3. Sometimes impossible
Using inferential statistics, can draw conclusions about a population based on a
sample
There are three “procedures” in inferential statistics:
1. Hypothesis testing
2. Point estimation
3. Interval estimation -> confidence interval
Hypothesis testing
Question: What is the mean of the population from which a sample of 50 cases was
drawn?
Examine whether mean of population is equal to a certain value or not -> hypotheses
are exclusive (only one H can be true) and exhaustive (all possible options should be
included)
Ex.: 𝐻 : 𝜇 = 2.5 and 𝐻 : 𝜇 ≠ 2.5
Two-sided test (𝐻 contains ≠), one-sided test (𝐻 contains > of <)
Test whether you can reject 𝐻 or not, if you reject 𝐻 , you conclude 𝐻 , i.e. µ is not
equal to 2.5
Rules of thumb for creating hypotheses:
1. 𝐻 contains “=” -> always the case
2. 𝐻 contains expectations of researcher -> often, but not always the case
One sided t-test 𝐻 : 𝜇 < 2.5 𝐻 : 𝜇 > 2.5
Steps in hypothesis testing
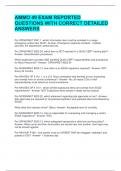
Step 1: Formulate hypotheses 𝐻 : µ = 2.5 and 𝐻 : 𝜇 ≠ 2.5
Step 2: Determine decision rule to decide when result is statistically sig. -> p < 𝛼
Step 3: Determine p-value based on SPSS output
Step 4: Decision on sig and conclusion
Apply to our ex.: Syntax
, 3
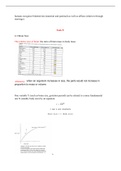
Logic hypothesis testing
Make an assumption about value of parameter (here µ) – null H (step 1)
This value is true, determine the possible values the sample statistic (here 𝑥̅ ) can take
(sampling distribution of 𝑥̅ ) in a simple random sample of N cases
Mean of sample distribution is µ, variance is 𝜎 ⁄𝑁
Using that sampling distribution, you determine the probability, so-called p-value
that the value of 𝑥̅ or a more extreme value occurs
In step 3 you determine position of 𝑥̅ in the sampling distribution, so you also
implicitly determine p-value
If p-value is lower than 𝛼: If 𝐻 true, then probability that I observe this value for 𝑥̅ or
an even more extreme value is smaller that 𝛼. This probability is so small that I do
not trust my null H anymore. I reject 𝐻 .
If p-value is larger than 𝛼: If my 𝐻 is true, then the probability that I observe this
value for 𝑥̅ or an even more extreme value is quite large. I do not have enough
reasons to doubt the correctness of 𝐻 . I do not reject 𝐻 .
In step 2, determine 𝛼 and decision rule, in step 4 you make the decision
Remark
One of the assumption is that sample is a ‘simple random sample’ meaning:
All cases have an equal chance to be sampled
Cases are selected independently of another
Test cannot be used if these assumptions are not met
One-sided vs. two-sided testing
Logic for one-sided and two-sided testing is the same
SPSS output is always two-sided
Convert two-sided “sig.” in SPSS output to correct (one-sided) value
, 4
Point estimation
Is used to answer the following question: What is the best guess of this parameter?
Which value lies closest to population value
In case of the mean µ, the guess is 𝑥̅
In case of variance 𝜎 , best guess is 𝑠
Interval estimation
With confidence intervals, you answer the following question: What is the interval in
which the value of the parameter lies with 95% confidence?
95% CI for µ: in 95% of times I draw a sample of N=50, CI will contain µ
Formula: 𝑥̅ ± 𝑡𝐶𝑉 ⋅ 𝑠⁄√𝑁
Relation CI and testing
you can use CI to test two-sided hypotheses
Decision rule: two-sided test with sig. level 𝛼
if 𝜇 falls in the 𝐶𝐼( )⋅ % you cannot reject 𝐻 in favour of two-sided alternative
if 𝜇 does not fall in the 𝐶𝐼( )⋅ % you can reject 𝐻 in favour of two-sided
alternative
Summary: Experimental Research Methods
Lecture 1: Introduction (Ch. 4, 5.6-5.9, 6-8, 12)
Experimental research methods -> techniques that show us how to
analyse experimental data
Descriptive Statistics
= summarize data
Data = numerical inform. of a population or sample
help summarize data -> list of raw data is unclear
two ways to summarize data: distribution or sample statistics
Distribution
data summarized by grouping data with the same score
this can be done in frequency distribution table or histogram
SPSS syntax to generate frequency distribution and histograms (syntax important
exam)
Sample statistics
Data summarized using characteristic features of the distribution
What are characteristic features of a distribution?
1. Most characteristic score of a distribution = central tendency
2. How much do scores deviate from the most characteristic score = dispersion
(variance)
Central tendency
Measures of central tendency are mean, median and mode
Mean of the data is the sum of all scores divided by the total number of scores
By hand:
, 2
Dispersion
Measures of dispersion are range, variance and the standard deviation
Variance of data is the sum of all squared deviance scores divided by the number of
scores minus one
𝑠 = , square root of variance = standard deviation, √𝑠
Inferential statistics
Descriptive statistics suffices if we have data of the entire population
Almost always we only have data of a sample & not the population, because:
1. Too expensive
2. Takes too long to collect these data
3. Sometimes impossible
Using inferential statistics, can draw conclusions about a population based on a
sample
There are three “procedures” in inferential statistics:
1. Hypothesis testing
2. Point estimation
3. Interval estimation -> confidence interval
Hypothesis testing
Question: What is the mean of the population from which a sample of 50 cases was
drawn?
Examine whether mean of population is equal to a certain value or not -> hypotheses
are exclusive (only one H can be true) and exhaustive (all possible options should be
included)
Ex.: 𝐻 : 𝜇 = 2.5 and 𝐻 : 𝜇 ≠ 2.5
Two-sided test (𝐻 contains ≠), one-sided test (𝐻 contains > of <)
Test whether you can reject 𝐻 or not, if you reject 𝐻 , you conclude 𝐻 , i.e. µ is not
equal to 2.5
Rules of thumb for creating hypotheses:
1. 𝐻 contains “=” -> always the case
2. 𝐻 contains expectations of researcher -> often, but not always the case
One sided t-test 𝐻 : 𝜇 < 2.5 𝐻 : 𝜇 > 2.5
Steps in hypothesis testing
Step 1: Formulate hypotheses 𝐻 : µ = 2.5 and 𝐻 : 𝜇 ≠ 2.5
Step 2: Determine decision rule to decide when result is statistically sig. -> p < 𝛼
Step 3: Determine p-value based on SPSS output
Step 4: Decision on sig and conclusion
Apply to our ex.: Syntax
, 3
Logic hypothesis testing
Make an assumption about value of parameter (here µ) – null H (step 1)
This value is true, determine the possible values the sample statistic (here 𝑥̅ ) can take
(sampling distribution of 𝑥̅ ) in a simple random sample of N cases
Mean of sample distribution is µ, variance is 𝜎 ⁄𝑁
Using that sampling distribution, you determine the probability, so-called p-value
that the value of 𝑥̅ or a more extreme value occurs
In step 3 you determine position of 𝑥̅ in the sampling distribution, so you also
implicitly determine p-value
If p-value is lower than 𝛼: If 𝐻 true, then probability that I observe this value for 𝑥̅ or
an even more extreme value is smaller that 𝛼. This probability is so small that I do
not trust my null H anymore. I reject 𝐻 .
If p-value is larger than 𝛼: If my 𝐻 is true, then the probability that I observe this
value for 𝑥̅ or an even more extreme value is quite large. I do not have enough
reasons to doubt the correctness of 𝐻 . I do not reject 𝐻 .
In step 2, determine 𝛼 and decision rule, in step 4 you make the decision
Remark
One of the assumption is that sample is a ‘simple random sample’ meaning:
All cases have an equal chance to be sampled
Cases are selected independently of another
Test cannot be used if these assumptions are not met
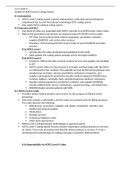
One-sided vs. two-sided testing
Logic for one-sided and two-sided testing is the same
SPSS output is always two-sided
Convert two-sided “sig.” in SPSS output to correct (one-sided) value
, 4
Point estimation
Is used to answer the following question: What is the best guess of this parameter?
Which value lies closest to population value
In case of the mean µ, the guess is 𝑥̅
In case of variance 𝜎 , best guess is 𝑠
Interval estimation
With confidence intervals, you answer the following question: What is the interval in
which the value of the parameter lies with 95% confidence?
95% CI for µ: in 95% of times I draw a sample of N=50, CI will contain µ
Formula: 𝑥̅ ± 𝑡𝐶𝑉 ⋅ 𝑠⁄√𝑁
Relation CI and testing
you can use CI to test two-sided hypotheses
Decision rule: two-sided test with sig. level 𝛼
if 𝜇 falls in the 𝐶𝐼( )⋅ % you cannot reject 𝐻 in favour of two-sided alternative
if 𝜇 does not fall in the 𝐶𝐼( )⋅ % you can reject 𝐻 in favour of two-sided
alternative