Introduction
Multivariate Data Analysis comprises all statistical methods that simultaneously analyse
multiple measurements on each individual or object under investigation.
- Measuring complex phenomena; e.g. intelligence
- Explain phenomena
- Dependent variables – independent variables relationships
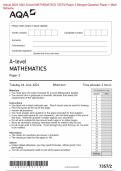
Data
- Metric or quantitative
o Interval scale; contain ordinal properties, and in addition, there are equal
differences between scale points.
o Ratio scale; contain interval scale properties, and in addition, there is natural
zero point.
- Nonmetric or qualitative
o Nominal scale; size of number is not related to the amount of the
characteristics being measured
o Ordinal scale; larger numbers indicate more (or less) of the characteristic
measured, but not how much more (or less)
The level of measurement is critical in determining the appropriate multivariate
technique to use.
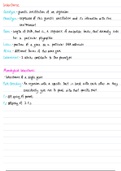
,Measurement Error always occur when working with variables.
- Multivariate techniques less powerful
- Distort observed relationships
- Researchers use summated scales, for which several variables are summed or
averaged together to form a composite representation of concept -> less error
because they are combined and measure the same thing than if you measure them
individually.
Validity is the absence of systematic error – reliability is the absence of random error
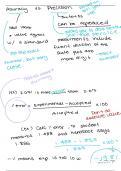
Hypotheses are conditional or unconditional statements
- Type I error or alpha is the probability of rejecting the null hypothesis when it is true
o 1% or 5% - beforehand
- Type II error or beta is the probability of failing to reject the null hypothesis when it is
false.
o Afterwards e.g. 20% is still acceptable
- Power or 1-beta is the probability of reject the null hypothesis when it is false
o Effect size: the actual magnitude of the effect of interest (e.g. the difference
between means or the correlation between variables)
o As alpha is set as smaller level, power decreases (typically 5%_
o Sample size: as the sample size increases, power increases. With very large
sample sizes, even very small effect can be statistically significant, raising the
issue of practical significance vs . statistical significance.
Power depends on alpha level and sample size
- Researchers should design the study to achieve power level of .80 at the desired
significance level.
- More stringent significance levels -> require larger samples – to achieve desired
power level
- Smaller effect sizes always require larger sample sizes to achieve the desired power.
Types of Multivariate Techniques
- Dependence techniques; a variable set of variables is identified as the dependent
variable to be predicted or explained by other variables known as independent
variables
o Multiple regression
, o Logistic regression; e.g. nominal
o ANOVA or ANCOVA
o Conjoint analysis
o Canonical correlation
o Structural equation modelling (SEM)
- Independence techniques; they involve the simultaneous analysis of all variables in
the set, without distinction between dependent variables and independent variables -
all the variables have the same status
o Factor analysis
o Cluster analysis
o Multidimensional scaling
o Correspondence analysis
Selecting a multivariate technique
1. What type of relationship is being examined – dependence or interdependence?
2. Dependence relationship: how many variables are being predicted
a. What is the measurement scale of the dependent variable?
b. What is the measurement scale of the predictor variable?
3. Interdependence relationship: are you examining relationships between variables,
respondents, or objects?
Factor Analysis analyses the structure of the interrelationships among a large number of
variables to determine a set of common underlying dimensions (factors).
- Interdependence technique
Analysis of Variance a metric dependent variable is predicted by a set oof nonmetric
(categorical) independent variables
- Dependence technique
- Extension; covariance considered
Multiple Regression a single metric dependent variable is predicted by several metric
independent variables.
Structural Equation Modelling estimates multiple, interrelated dependence relationships
based on two components;
- Structural model
- Measurement model
Guidelines
- Establish practical significance as well as statistical significance -> do the results
matter in the real world?
- Samples size affects all results
- Know your data
- Strive for model parsimony; few as possible variables – as simple as possible -> with
great explanatory predictive power
- Look at your errors; all errors that can occur
- Validates your results; do multiple analyses
Structured way
1. Define the research problem, objectives, and multivariate technique(s) to be used
2. Develop the analysis plan
3. Evaluate the assumptions underlying the multivariate technique(s)
4. Estimate the multivariate model and assess overall model fit; does it work in the real
world? And is it a good explanation? Good representation of the world?
5. Interpret the coefficients
Multivariate Data Analysis comprises all statistical methods that simultaneously analyse
multiple measurements on each individual or object under investigation.
- Measuring complex phenomena; e.g. intelligence
- Explain phenomena
- Dependent variables – independent variables relationships
Data
- Metric or quantitative
o Interval scale; contain ordinal properties, and in addition, there are equal
differences between scale points.
o Ratio scale; contain interval scale properties, and in addition, there is natural
zero point.
- Nonmetric or qualitative
o Nominal scale; size of number is not related to the amount of the
characteristics being measured
o Ordinal scale; larger numbers indicate more (or less) of the characteristic
measured, but not how much more (or less)
The level of measurement is critical in determining the appropriate multivariate
technique to use.
,Measurement Error always occur when working with variables.
- Multivariate techniques less powerful
- Distort observed relationships
- Researchers use summated scales, for which several variables are summed or
averaged together to form a composite representation of concept -> less error
because they are combined and measure the same thing than if you measure them
individually.
Validity is the absence of systematic error – reliability is the absence of random error
Hypotheses are conditional or unconditional statements
- Type I error or alpha is the probability of rejecting the null hypothesis when it is true
o 1% or 5% - beforehand
- Type II error or beta is the probability of failing to reject the null hypothesis when it is
false.
o Afterwards e.g. 20% is still acceptable
- Power or 1-beta is the probability of reject the null hypothesis when it is false
o Effect size: the actual magnitude of the effect of interest (e.g. the difference
between means or the correlation between variables)
o As alpha is set as smaller level, power decreases (typically 5%_
o Sample size: as the sample size increases, power increases. With very large
sample sizes, even very small effect can be statistically significant, raising the
issue of practical significance vs . statistical significance.
Power depends on alpha level and sample size
- Researchers should design the study to achieve power level of .80 at the desired
significance level.
- More stringent significance levels -> require larger samples – to achieve desired
power level
- Smaller effect sizes always require larger sample sizes to achieve the desired power.
Types of Multivariate Techniques
- Dependence techniques; a variable set of variables is identified as the dependent
variable to be predicted or explained by other variables known as independent
variables
o Multiple regression
, o Logistic regression; e.g. nominal
o ANOVA or ANCOVA
o Conjoint analysis
o Canonical correlation
o Structural equation modelling (SEM)
- Independence techniques; they involve the simultaneous analysis of all variables in
the set, without distinction between dependent variables and independent variables -
all the variables have the same status
o Factor analysis
o Cluster analysis
o Multidimensional scaling
o Correspondence analysis
Selecting a multivariate technique
1. What type of relationship is being examined – dependence or interdependence?
2. Dependence relationship: how many variables are being predicted
a. What is the measurement scale of the dependent variable?
b. What is the measurement scale of the predictor variable?
3. Interdependence relationship: are you examining relationships between variables,
respondents, or objects?
Factor Analysis analyses the structure of the interrelationships among a large number of
variables to determine a set of common underlying dimensions (factors).
- Interdependence technique
Analysis of Variance a metric dependent variable is predicted by a set oof nonmetric
(categorical) independent variables
- Dependence technique
- Extension; covariance considered
Multiple Regression a single metric dependent variable is predicted by several metric
independent variables.
Structural Equation Modelling estimates multiple, interrelated dependence relationships
based on two components;
- Structural model
- Measurement model
Guidelines
- Establish practical significance as well as statistical significance -> do the results
matter in the real world?
- Samples size affects all results
- Know your data
- Strive for model parsimony; few as possible variables – as simple as possible -> with
great explanatory predictive power
- Look at your errors; all errors that can occur
- Validates your results; do multiple analyses
Structured way
1. Define the research problem, objectives, and multivariate technique(s) to be used
2. Develop the analysis plan
3. Evaluate the assumptions underlying the multivariate technique(s)
4. Estimate the multivariate model and assess overall model fit; does it work in the real
world? And is it a good explanation? Good representation of the world?
5. Interpret the coefficients