General definitions
Definitions
Statistics = organizing, summarizing and interpreting data.
Descriptive statistics = statistics that organize and summarize data.
Inferential statistics = statistics that make generalizations about the populations through samples.
▪ Variable = a characteristic or condition of the object that is studied
➢ Quantitative variable = numeric values that you can calculate with (so no ID’s etc.)
➢ Qualitative variable = non-numeric values
o Discrete variable = variable that consists of indivisible categories
o Continuous variable = variable that consists of divisible categories. The boundaries
are called ‘real limits’ and are halfway the adjacent scores. For the interval 80-84, the
real limits are 79.5 and 84.5.
▪ Parameter = value that describes a population. | Statistic = value that describes a sample.
▪ Sampling error = the naturally occurring difference between a statistic and a parameter.
Descriptive statistics
Measurement scales
Nominal Ordinal Interval Ratio
- Values - Values - Values - Values
- Order (more or less) - Order - Order
- Equal differences - Equal differences
- Has no natural zero - Has a natural zero point
point - Has no negative values
E.g. car brands, E.g. opinion scale, level E.g. grades, temperature E.g. age, length, weight,
eye colors of education in Celsius price, time, temp. in
Kelvin
Mode Mode, median Mode, median, mean Mode, median, mean
, Descriptive measurements
Frequency measurements
• Tables, pie charts, graphs
• ‘absolute frequency’ = 21 out of 500 | ‘relative frequency’ = 0.042, or 4.2%
o Frequency bar graph (space between bars → nominal or ordinal scale
o Histogram (no space between bars) → interval or ratio scale
Measure of location / central tendency
• Mean: balance point of the distribution (sum of all values, divided by the number of values).
o / u for population (usually unknown) with population size = ‘N’. | or M for sample with sample
size = ‘n’.
• Median: midpoint of the distribution (tick outer-left and outer-right values away, then again, and again, until
you have 1 number left, or 2 numbers from which you then take the average.
• Mode: the score with the highest frequency.
The goal is to find the single score that is most representative. The mean is often considered as the best measure, but
in certain situations, the median or mode is the most representative:
➔ Median: extreme scores // skewed distributions // undetermined values (if 1 in 10 kids can’t solve the puzzle,
the mean would say that 1 in 10 of the population can’t solve it) // open-ended distributions (category has an
upper limit but no down limit, or the other way around) // ordinal scale (ordinal has no distance; distance
matters for mean, but not for median).
➔ Mode: nominal scale, discrete variables (you want ‘a house typically has 2 children’ instead of 2.3 children) //
describing shape (for e.g. exam scores, the distribution peak is the mode).
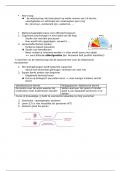
Measure of shape
• Skewness / sk measures the distribution’s deviation from symmetry.
o Symmetric distribution: sk = 0
o Titled towards the left: sk > 0 (positive skew)
o Titled towards the right: sk < 0 (negative skew)
The mean is pretty much always on the outer side, because it is influenced by extreme
scores in the tail of the distribution.
Measure of dispersion / variability Variance and standard Variance and standard
deviation of population deviation of sample
How spread out or clustered are your scores? → the more spread out your sample
scores are, the more errors you can expect.
• Range: difference between the largest and the smallest score of distribution.
• Interquartile range: distance between Q1, 25% and Q3, 75%.
Variance (O2): average of the squared deviations (distances from the mean).
Standard deviation (O): square root of the variance → typical distance from u.
Sum of squares (SS): the sum of the squared distances from the mean.
Degrees of freedom (df): ‘n – 1’, used for samples. If n = 15 → 14 scores are free to vary.
Definitions
Statistics = organizing, summarizing and interpreting data.
Descriptive statistics = statistics that organize and summarize data.
Inferential statistics = statistics that make generalizations about the populations through samples.
▪ Variable = a characteristic or condition of the object that is studied
➢ Quantitative variable = numeric values that you can calculate with (so no ID’s etc.)
➢ Qualitative variable = non-numeric values
o Discrete variable = variable that consists of indivisible categories
o Continuous variable = variable that consists of divisible categories. The boundaries
are called ‘real limits’ and are halfway the adjacent scores. For the interval 80-84, the
real limits are 79.5 and 84.5.
▪ Parameter = value that describes a population. | Statistic = value that describes a sample.
▪ Sampling error = the naturally occurring difference between a statistic and a parameter.
Descriptive statistics
Measurement scales
Nominal Ordinal Interval Ratio
- Values - Values - Values - Values
- Order (more or less) - Order - Order
- Equal differences - Equal differences
- Has no natural zero - Has a natural zero point
point - Has no negative values
E.g. car brands, E.g. opinion scale, level E.g. grades, temperature E.g. age, length, weight,
eye colors of education in Celsius price, time, temp. in
Kelvin
Mode Mode, median Mode, median, mean Mode, median, mean
, Descriptive measurements
Frequency measurements
• Tables, pie charts, graphs
• ‘absolute frequency’ = 21 out of 500 | ‘relative frequency’ = 0.042, or 4.2%
o Frequency bar graph (space between bars → nominal or ordinal scale
o Histogram (no space between bars) → interval or ratio scale
Measure of location / central tendency
• Mean: balance point of the distribution (sum of all values, divided by the number of values).
o / u for population (usually unknown) with population size = ‘N’. | or M for sample with sample
size = ‘n’.
• Median: midpoint of the distribution (tick outer-left and outer-right values away, then again, and again, until
you have 1 number left, or 2 numbers from which you then take the average.
• Mode: the score with the highest frequency.
The goal is to find the single score that is most representative. The mean is often considered as the best measure, but
in certain situations, the median or mode is the most representative:
➔ Median: extreme scores // skewed distributions // undetermined values (if 1 in 10 kids can’t solve the puzzle,
the mean would say that 1 in 10 of the population can’t solve it) // open-ended distributions (category has an
upper limit but no down limit, or the other way around) // ordinal scale (ordinal has no distance; distance
matters for mean, but not for median).
➔ Mode: nominal scale, discrete variables (you want ‘a house typically has 2 children’ instead of 2.3 children) //
describing shape (for e.g. exam scores, the distribution peak is the mode).
Measure of shape
• Skewness / sk measures the distribution’s deviation from symmetry.
o Symmetric distribution: sk = 0
o Titled towards the left: sk > 0 (positive skew)
o Titled towards the right: sk < 0 (negative skew)
The mean is pretty much always on the outer side, because it is influenced by extreme
scores in the tail of the distribution.
Measure of dispersion / variability Variance and standard Variance and standard
deviation of population deviation of sample
How spread out or clustered are your scores? → the more spread out your sample
scores are, the more errors you can expect.
• Range: difference between the largest and the smallest score of distribution.
• Interquartile range: distance between Q1, 25% and Q3, 75%.
Variance (O2): average of the squared deviations (distances from the mean).
Standard deviation (O): square root of the variance → typical distance from u.
Sum of squares (SS): the sum of the squared distances from the mean.
Degrees of freedom (df): ‘n – 1’, used for samples. If n = 15 → 14 scores are free to vary.