MAT 300 Unit 4 Milestone 4 Exam
Answer Sophia Course Many Sets
Click below link for Answers
https://www.sobtell.com/q/tutorial/default/206481-mat-300-unit-4-milestone-4-exam-answer-
sophia-cour-110106
https://www.sobtell.com/q/tutorial/default/206481-mat-300-unit-4-milestone-4-exam-answer-
sophia-cour-110106
1
Which statement about correlation is FALSE?
•
The correlation of a data set can be positive, negative, or 0.
•
Correlation is used to define the variables of only non-linearly related data sets.
•
Correlation between the variables of the data set can be measured.
•
Correlation is the degree to which the two variables of a data set resemble each other.
2
Which of the following is a guideline for establishing causality?
•
Keep all variables the same to get duplicate results.
•
Do not consider other possible causes.
•
Check if the effect is present or absent when the response variable is present or absent.
•
Look for cases where correlation exists between the variables of a scatterplot.
3
Data for weight (in pounds) and age (in months) of babies is entered into a statistics software
package and results in a regression equation of ŷ = 17 + 0.8x.
What is the correct interpretation of the slope if the weight is the response variable and the
age is the explanatory variable?
•
The weight of a baby decreases by 0.8 pounds, on average, when the baby's age increases by
1 month.
•
The weight of a baby increases by 0.8 pounds, on average, when the baby's age increases by
1 month.
•
The weight of a baby decreases by 17 pounds, on average, when the baby's age increases by 1
month.
•
The weight of a baby increases by 17 pounds, on average, when the baby's age increases by 1
month.
4
, Jesse takes two data points from the weight and feed cost data set to calculate a slope, or
average rate of change. A hamster weighs half a pound and costs $2 per week to feed, while a
Labrador Retriever weighs 62.5 pounds and costs $10 per week to feed.
Using weight as the explanatory variable, what is the slope of a line between these two
points? Answer choices are rounded to the nearest hundredth.
•
$7.75 / lb.
•
$0.13 / lb.
•
$6.25 / lb.
•
$4.00 / lb.
5
For a set of data, x is the explanatory variable. Its mean is 8.2, and its standard deviation is
1.92.
For the same set of data, y is the response variable. Its mean is 13.8, and its standard
deviation is 3.03.
The correlation was found to be 0.223.
Select the correct slope and y-intercept for the least-squares line.
•
Slope = 0.35
y-intercept = 10.9
•
Slope = -0.35
y-intercept = 10.9
•
Slope = 0.35
y-intercept = -10.9
•
Slope = -0.35
y-intercept = -10.9
6
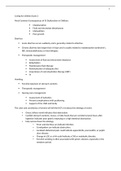
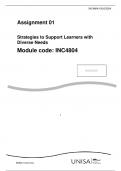
Thomas was interested in learning more about the salary of a teacher. He believed as a
teacher increases in age, the annual earnings also increases. The age (in years) is plotted
against the earnings (in dollars) as shown below.
Using the best-fit line, approximately how much money would a 45-year-old teacher make?
•
$50,000
•
$55,000
•
$58,000
•
$48,000
7
Shawna finds a study of American men that has an equation to predict weight (in pounds)
from height (in inches): ŷ = -210 + 5.6x. Shawna's dad’s height is 72 inches and he weighs
182 pounds.
What is the residual of weight and height for Shawna's dad?
Answer Sophia Course Many Sets
Click below link for Answers
https://www.sobtell.com/q/tutorial/default/206481-mat-300-unit-4-milestone-4-exam-answer-
sophia-cour-110106
https://www.sobtell.com/q/tutorial/default/206481-mat-300-unit-4-milestone-4-exam-answer-
sophia-cour-110106
1
Which statement about correlation is FALSE?
•
The correlation of a data set can be positive, negative, or 0.
•
Correlation is used to define the variables of only non-linearly related data sets.
•
Correlation between the variables of the data set can be measured.
•
Correlation is the degree to which the two variables of a data set resemble each other.
2
Which of the following is a guideline for establishing causality?
•
Keep all variables the same to get duplicate results.
•
Do not consider other possible causes.
•
Check if the effect is present or absent when the response variable is present or absent.
•
Look for cases where correlation exists between the variables of a scatterplot.
3
Data for weight (in pounds) and age (in months) of babies is entered into a statistics software
package and results in a regression equation of ŷ = 17 + 0.8x.
What is the correct interpretation of the slope if the weight is the response variable and the
age is the explanatory variable?
•
The weight of a baby decreases by 0.8 pounds, on average, when the baby's age increases by
1 month.
•
The weight of a baby increases by 0.8 pounds, on average, when the baby's age increases by
1 month.
•
The weight of a baby decreases by 17 pounds, on average, when the baby's age increases by 1
month.
•
The weight of a baby increases by 17 pounds, on average, when the baby's age increases by 1
month.
4
, Jesse takes two data points from the weight and feed cost data set to calculate a slope, or
average rate of change. A hamster weighs half a pound and costs $2 per week to feed, while a
Labrador Retriever weighs 62.5 pounds and costs $10 per week to feed.
Using weight as the explanatory variable, what is the slope of a line between these two
points? Answer choices are rounded to the nearest hundredth.
•
$7.75 / lb.
•
$0.13 / lb.
•
$6.25 / lb.
•
$4.00 / lb.
5
For a set of data, x is the explanatory variable. Its mean is 8.2, and its standard deviation is
1.92.
For the same set of data, y is the response variable. Its mean is 13.8, and its standard
deviation is 3.03.
The correlation was found to be 0.223.
Select the correct slope and y-intercept for the least-squares line.
•
Slope = 0.35
y-intercept = 10.9
•
Slope = -0.35
y-intercept = 10.9
•
Slope = 0.35
y-intercept = -10.9
•
Slope = -0.35
y-intercept = -10.9
6
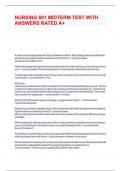
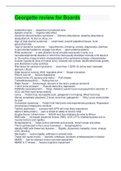
Thomas was interested in learning more about the salary of a teacher. He believed as a
teacher increases in age, the annual earnings also increases. The age (in years) is plotted
against the earnings (in dollars) as shown below.
Using the best-fit line, approximately how much money would a 45-year-old teacher make?
•
$50,000
•
$55,000
•
$58,000
•
$48,000
7
Shawna finds a study of American men that has an equation to predict weight (in pounds)
from height (in inches): ŷ = -210 + 5.6x. Shawna's dad’s height is 72 inches and he weighs
182 pounds.
What is the residual of weight and height for Shawna's dad?