Lieve Göbbels
Visualization (JBI100)
Semester 1, 2021-2022
Visualization
Introduction to Visualization 2
Introduction 2
Three types of goals 2
Visualization design 2
Visualization Design and Encodings 4
Nested model 4
Analysis framework 5
Marks and Channels 9
Marks and channels 9
Relative judgements 9
Eight Rules of Thumb 11
Rules of thumb 11
Arrange Tables 13
Arrange tables 13
Map Color and Other Channels 18
Color theory 18
Colormaps and other channels 19
,Introduction to Visualization
In short:
• Introduction
• Three types of goals
• Visualization design
Introduction
Visualization is the art of making the unseen visible. Numbers in itself do not (always) tell the whole
story. Visualization can be de ned as follows: “computer-based systems provide visual
representations of data sets, designed to help people carry out tasks more e ectively” (Munzner).
Since, many analysis problems are ill-de ned, computational techniques from statistics and machine
learning often do not su ce. Visualization is mainly used to augment the human capabilities. Data
visualization is more a cognitive process than just making ‘pretty pictures’; it is about making useful
pictures. Here, it is important to be aware of trade-o s in visualization design, validating designs and
the limitations of computers, humans and displays. Additionally, it is important to consider the
di erent kinds of uses of visualization tools. Tools, for example, can be designed for transitional use
(computers taking over the job), but also for long-term use (maintaining the human in the loop).
Another example is to design tools for the sake of presentation.
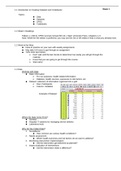
One of the earliest visualizations is the London Cholera Map made in 1854 by John Snow.
This is an intuitive graphical illustration of Cholera outbreaks (dots) on the London map. However, in
the present day, the sizes of data get bigger and bigger, which requires a graphical approach. Such
an approach is often adapted from other elds, like infographics or business graphics.
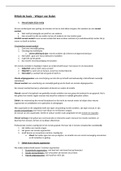
In the book by Munzner, several questions are posed, and answered (see table).
Three types of goals
Visualization has three types of goals:
1. data exploration (when nothing is known);
2. veri cation or falsi cation (when there are hypotheses);
3. communicating results (when everything about the data is known).
Additionally, there are two main sub elds of visualization, namely InfoVis and SciVis. In this course
we only deal with InfoVis. The main di erences between these two elds are that InfoVis uses N-
dimensional heterogeneous abstract data with no spatial reference, while SciVis uses 2- or 3-
dimensional spatial data with spatial reference.
Visualization design
There are a lot of design alternatives, that all have di erent tradeo s. However, there are many
possibilities that are known to be ine ective. For example, it is best to avoid randomly applying
possibilities, and to avoid what is seen as mistakes in the current consensus. Note that these
‘guidelines’ continue to evolve in line with new research ndings. Therefore, it can be bene cial to
use some kind of iterative re nement. Currently, one of the practices in the design process that is
considered a good practice is to start broadly, in the known space, and then work to a smaller
, solution, instead of already starting with a small known space. That is, because starting small is keen
to getting stuck at a poor solution (basically arriving at the wrong minimum instead of a satis able
solution).
Question Answer
It provides the possibility to build tools dealing with large data sets that are
Why have a computer in the loop?
infeasible to do manually
External representations augment human capacity by providing the
Why use an external representation?
possibility to surpass the limitations of the human cognition and memory
The visual system provides a high-bandwidth channel to the human brain,
Why depend on vision? while soni cation is unsuited and the other senses have severe
technological limitations
Data structures are sometimes necessary to provide all the relevant
Why show the data in detail? information, e.g. when looking for patterns or when assessing the validity
of a statistical model
Why use interactivity? Interactivity is crucial for building tools that handle complexity
Why is the visualization idiom design There are many ways to create visual encodings, especially when using
space huge? interaction
Tools are contextual, reframing the task into abstract form provides the
Why focus on tasks?
possibility to generalize
Why focus on effectiveness? It is embedded in the goal of supporting the user’s tasks
The majority of the possibilities in the design space are ineffective for
Why are most designs ineffective? speci c usage context, the goal is to nd one of the possible good
solutions (satisfy)
Why is validation dif cult? There are many different viewpoints and therewith questions to ask
There is limited computational (scalability), cognitive and perceptual
Why are there resource limitations? (change blindness), and display capacity (information density/data-ink
ratio)
Why analyze? It can acts as a guide, e.g. using the what-why-how framework
Visualization (JBI100)
Semester 1, 2021-2022
Visualization
Introduction to Visualization 2
Introduction 2
Three types of goals 2
Visualization design 2
Visualization Design and Encodings 4
Nested model 4
Analysis framework 5
Marks and Channels 9
Marks and channels 9
Relative judgements 9
Eight Rules of Thumb 11
Rules of thumb 11
Arrange Tables 13
Arrange tables 13
Map Color and Other Channels 18
Color theory 18
Colormaps and other channels 19
,Introduction to Visualization
In short:
• Introduction
• Three types of goals
• Visualization design
Introduction
Visualization is the art of making the unseen visible. Numbers in itself do not (always) tell the whole
story. Visualization can be de ned as follows: “computer-based systems provide visual
representations of data sets, designed to help people carry out tasks more e ectively” (Munzner).
Since, many analysis problems are ill-de ned, computational techniques from statistics and machine
learning often do not su ce. Visualization is mainly used to augment the human capabilities. Data
visualization is more a cognitive process than just making ‘pretty pictures’; it is about making useful
pictures. Here, it is important to be aware of trade-o s in visualization design, validating designs and
the limitations of computers, humans and displays. Additionally, it is important to consider the
di erent kinds of uses of visualization tools. Tools, for example, can be designed for transitional use
(computers taking over the job), but also for long-term use (maintaining the human in the loop).
Another example is to design tools for the sake of presentation.
One of the earliest visualizations is the London Cholera Map made in 1854 by John Snow.
This is an intuitive graphical illustration of Cholera outbreaks (dots) on the London map. However, in
the present day, the sizes of data get bigger and bigger, which requires a graphical approach. Such
an approach is often adapted from other elds, like infographics or business graphics.
In the book by Munzner, several questions are posed, and answered (see table).
Three types of goals
Visualization has three types of goals:
1. data exploration (when nothing is known);
2. veri cation or falsi cation (when there are hypotheses);
3. communicating results (when everything about the data is known).
Additionally, there are two main sub elds of visualization, namely InfoVis and SciVis. In this course
we only deal with InfoVis. The main di erences between these two elds are that InfoVis uses N-
dimensional heterogeneous abstract data with no spatial reference, while SciVis uses 2- or 3-
dimensional spatial data with spatial reference.
Visualization design
There are a lot of design alternatives, that all have di erent tradeo s. However, there are many
possibilities that are known to be ine ective. For example, it is best to avoid randomly applying
possibilities, and to avoid what is seen as mistakes in the current consensus. Note that these
‘guidelines’ continue to evolve in line with new research ndings. Therefore, it can be bene cial to
use some kind of iterative re nement. Currently, one of the practices in the design process that is
considered a good practice is to start broadly, in the known space, and then work to a smaller
, solution, instead of already starting with a small known space. That is, because starting small is keen
to getting stuck at a poor solution (basically arriving at the wrong minimum instead of a satis able
solution).
Question Answer
It provides the possibility to build tools dealing with large data sets that are
Why have a computer in the loop?
infeasible to do manually
External representations augment human capacity by providing the
Why use an external representation?
possibility to surpass the limitations of the human cognition and memory
The visual system provides a high-bandwidth channel to the human brain,
Why depend on vision? while soni cation is unsuited and the other senses have severe
technological limitations
Data structures are sometimes necessary to provide all the relevant
Why show the data in detail? information, e.g. when looking for patterns or when assessing the validity
of a statistical model
Why use interactivity? Interactivity is crucial for building tools that handle complexity
Why is the visualization idiom design There are many ways to create visual encodings, especially when using
space huge? interaction
Tools are contextual, reframing the task into abstract form provides the
Why focus on tasks?
possibility to generalize
Why focus on effectiveness? It is embedded in the goal of supporting the user’s tasks
The majority of the possibilities in the design space are ineffective for
Why are most designs ineffective? speci c usage context, the goal is to nd one of the possible good
solutions (satisfy)
Why is validation dif cult? There are many different viewpoints and therewith questions to ask
There is limited computational (scalability), cognitive and perceptual
Why are there resource limitations? (change blindness), and display capacity (information density/data-ink
ratio)
Why analyze? It can acts as a guide, e.g. using the what-why-how framework