2IAB0 - Data Analytics for
Engineers
Week 1: EDA
EDA = Exploratory Data Analysis
Data types:
1. Categorical data - data that has no intrinsic numerical value
• Nominal: two or more outcomes that have no natural order
• Ordinal: two or more outcomes that have a natural order
2. Numerical data - data that has an intrinsic numerical value
• Continuous data: data that can attain any value on a given measurement scale
- Interval data: equal intervals represent equal di erences
- Ratio data: both di erences and ratios make sense; it has a xed ‘ zero point’
• Discrete data: data that can only attain certain values
Tables:
Reference table: store ‘all’ data in a table so that it can be looked up easily
Demonstration table: table to illustrate a point (so present just enough data, or speci c
summary)
Plots:
• Dot plots
- Good for showing actual values and structure of numerical values
- Not suitable for large data sets
- Jitter option may help to avoid overlapping dots
• Bar chart
- For comparing some numerical characteristics of groups de ned by categories of
categorical data
- Levels of categorical variable are on the x-axis, numerical values on the y-axis
• Histogram
- Not convenient for large data sets
- Range of data is split in bins (= intervals of values)
- Histogram shows the number of observations in the data set for every bin
2
- Rule of thumb for choosing a sensible number of bins: ≈ n where n is the number of
data points
• Cumulative histogram
- Shows counts or percentages of the current bin together with the counts or percentages
of all bins to the left of that bin
• Scatter plot
- Allows to investigate relations
! Bar charts are for categorical data, histograms for numerical data
Types of summary statistics:
• Level: location summary statistics
• Spread: scale summary statistics
• Relation: association summary statistics
1
ff ff fifi fi
, Location summary statistics:
1 n
n∑
1. Mean (average): xi
i=1
2. Median:
- Odd number of observations: middle value when ordered from small to large
- Even number of observations: average of two middle values when ordered from small to
large
3. Mode: most frequently occurring value, may be non-unique
! Mean is sensitive to ‘outliers’ => mean can be misleading / di cult to interpret for non-
symmetric data sets
Quartiles:
- 1st quartile = cut-o point for 25% of the data
- 2nd quartile = cut-o point for 50% of the data (= median)
- 3rd quartile = cut-o point for 75% of the data
Percentiles:
- Pth percentile - a cut-o point for P% of the data
- We de ne the 0th percentile to be the smallest element of the dataset and the 100th percentile
to be the largest element of it
- For a dataset with n observations, the 2 smallest observation will be at 100/(n − 1)th
percentile
- For percentile P we compute its location in a data set of n
observations: Lp = 1 + (P/100)*(n-1)
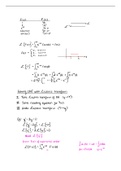
- Computing Pth percentile value by linear interpolation:
Scale statistics:
• Range = max - min
• Interquartile range (IQR) = 3rd quartile - 1st quartile
n
(xi − μ)2
∑
i=1
• Sample variance = S or
2 σ2 =
n−1
n
(xi − μ)2
∑
i=1
Sample standard deviation = S or σ =
• n−1
• Median absolute deviation (MAD): median of the absolute deviation from the median
The higher these statistics, the more the spread/variability in the data.
! The range, variance and standard deviation are sensitive to ‘outliers’, IQR and MAD are not.
2
fi ffff ff ffi
, Standardization:
The z-score transforms data in their original units into universal statistical unit of standard
deviation from the mean. The mean value of the z-scores of data set is 0 and the standard
deviation is 1.
Negative z-score: value is below mean
Positive z-score: value is above mean
Rule of thumb: observations with a z-score larger than 2.5 are considered to be ‘outliers’.
Association statistics:
Association statistics try to capture in a number how strong the relation between two quantities is.
The sign of an association statistic indicates whether it is:
- A positive association
- A negative association
Box and whisker plot:
• Median
• 1st and 3 quartile
• Min and max values
• Endpoints of whiskers show minimum/maximum if within 1.5 IQR from the nearest 1st/3rd
quartile
• Points further away than 1.5 IQR from nearest quartile are outliers
• Yield a quick indication of symmetry
• Indicate whether there are outliers
Kernel density plots (improved histograms):
• Choose a bandwidth to be taken around each data point
• Generate a kernel with the chosen bandwidth for every data point
• Count the data points weighted by the kernel
• There is no direct interpretation of the scale of the y-axis!
Violin plot:
• Combination of box-and-whisker plot and kernel density plot:
• Global shape of box-and-whisker plot
• Local details of kernel density plot
Typical distribution shapes:
- Unimodal distribution: 1 peak
- Bimodal distribution: 2 peaks
- Symmetric distribution
- Right-skewed distribution: long tail on the right, asymmetry may indicate ‘extreme values’
3
Engineers
Week 1: EDA
EDA = Exploratory Data Analysis
Data types:
1. Categorical data - data that has no intrinsic numerical value
• Nominal: two or more outcomes that have no natural order
• Ordinal: two or more outcomes that have a natural order
2. Numerical data - data that has an intrinsic numerical value
• Continuous data: data that can attain any value on a given measurement scale
- Interval data: equal intervals represent equal di erences
- Ratio data: both di erences and ratios make sense; it has a xed ‘ zero point’
• Discrete data: data that can only attain certain values
Tables:
Reference table: store ‘all’ data in a table so that it can be looked up easily
Demonstration table: table to illustrate a point (so present just enough data, or speci c
summary)
Plots:
• Dot plots
- Good for showing actual values and structure of numerical values
- Not suitable for large data sets
- Jitter option may help to avoid overlapping dots
• Bar chart
- For comparing some numerical characteristics of groups de ned by categories of
categorical data
- Levels of categorical variable are on the x-axis, numerical values on the y-axis
• Histogram
- Not convenient for large data sets
- Range of data is split in bins (= intervals of values)
- Histogram shows the number of observations in the data set for every bin
2
- Rule of thumb for choosing a sensible number of bins: ≈ n where n is the number of
data points
• Cumulative histogram
- Shows counts or percentages of the current bin together with the counts or percentages
of all bins to the left of that bin
• Scatter plot
- Allows to investigate relations
! Bar charts are for categorical data, histograms for numerical data
Types of summary statistics:
• Level: location summary statistics
• Spread: scale summary statistics
• Relation: association summary statistics
1
ff ff fifi fi
, Location summary statistics:
1 n
n∑
1. Mean (average): xi
i=1
2. Median:
- Odd number of observations: middle value when ordered from small to large
- Even number of observations: average of two middle values when ordered from small to
large
3. Mode: most frequently occurring value, may be non-unique
! Mean is sensitive to ‘outliers’ => mean can be misleading / di cult to interpret for non-
symmetric data sets
Quartiles:
- 1st quartile = cut-o point for 25% of the data
- 2nd quartile = cut-o point for 50% of the data (= median)
- 3rd quartile = cut-o point for 75% of the data
Percentiles:
- Pth percentile - a cut-o point for P% of the data
- We de ne the 0th percentile to be the smallest element of the dataset and the 100th percentile
to be the largest element of it
- For a dataset with n observations, the 2 smallest observation will be at 100/(n − 1)th
percentile
- For percentile P we compute its location in a data set of n
observations: Lp = 1 + (P/100)*(n-1)
- Computing Pth percentile value by linear interpolation:
Scale statistics:
• Range = max - min
• Interquartile range (IQR) = 3rd quartile - 1st quartile
n
(xi − μ)2
∑
i=1
• Sample variance = S or
2 σ2 =
n−1
n
(xi − μ)2
∑
i=1
Sample standard deviation = S or σ =
• n−1
• Median absolute deviation (MAD): median of the absolute deviation from the median
The higher these statistics, the more the spread/variability in the data.
! The range, variance and standard deviation are sensitive to ‘outliers’, IQR and MAD are not.
2
fi ffff ff ffi
, Standardization:
The z-score transforms data in their original units into universal statistical unit of standard
deviation from the mean. The mean value of the z-scores of data set is 0 and the standard
deviation is 1.
Negative z-score: value is below mean
Positive z-score: value is above mean
Rule of thumb: observations with a z-score larger than 2.5 are considered to be ‘outliers’.
Association statistics:
Association statistics try to capture in a number how strong the relation between two quantities is.
The sign of an association statistic indicates whether it is:
- A positive association
- A negative association
Box and whisker plot:
• Median
• 1st and 3 quartile
• Min and max values
• Endpoints of whiskers show minimum/maximum if within 1.5 IQR from the nearest 1st/3rd
quartile
• Points further away than 1.5 IQR from nearest quartile are outliers
• Yield a quick indication of symmetry
• Indicate whether there are outliers
Kernel density plots (improved histograms):
• Choose a bandwidth to be taken around each data point
• Generate a kernel with the chosen bandwidth for every data point
• Count the data points weighted by the kernel
• There is no direct interpretation of the scale of the y-axis!
Violin plot:
• Combination of box-and-whisker plot and kernel density plot:
• Global shape of box-and-whisker plot
• Local details of kernel density plot
Typical distribution shapes:
- Unimodal distribution: 1 peak
- Bimodal distribution: 2 peaks
- Symmetric distribution
- Right-skewed distribution: long tail on the right, asymmetry may indicate ‘extreme values’
3