AQA GCSE MATHEMATICS Higher Tier
Paper 2 Calculator QP 2021
Please write clearly in block capitals.
Centre number Candidate number
Surname
Forename(s)
Candidate signature
I declare this is my own work.
GCSE
MATHEMATICS
Higher Tier Paper 2 Calculator
H
Thursday 4 June 2020 Morning Time allowed: 1 hour 30 minutes
Materials For Examiner’s Use
For this paper you must have:
Pages Mark
• a calculator
• mathematical instruments. 2–3
4–5
Instructions
6–7
• Use black ink or black ball-point pen. Draw diagrams in pencil.
8–9
• Fill in the boxes at the top of this page.
• Answer all questions. 10–11
• You must answer the questions in the spaces provided. Do not write 12–13
outside the box around each page or on blank pages. 14–15
• If you need extra space for your answer(s), use the lined pages at the end of
16–17
this book. Write the question number against your answer(s).
• Do all rough work in this book. Cross through any work you do not want to 18–19
be marked. 20–21
22–23
Information
24–25
• The marks for questions are shown in brackets.
26–27
• The maximum mark for this paper is 80.
• You may ask for more answer paper, graph paper and tracing paper. 28–29
These must be tagged securely to this answer book.
TOTAL
Advice
In all calculations, show clearly how you work out your answer.
*Jun2083002H01*
IB/M/Jun20/E7 8300/2H
, 2
Do not write
outside the
Answer all questions in the spaces provided. box
1 Which of these is a correct identity?
Circle your answer.
[1 mark]
x + 4x ≡ 5x 6x ≡ 18 2x + 1 ≡ 7 7x + 9 ≡ x
2
Not drawn
accurately
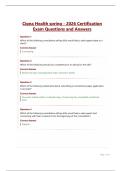
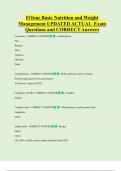
Circle the reason why these triangles are congruent.
[1 mark]
RHS ASA SSS SAS
*02*
IB/M/Jun20/8300/2H
, 3
Do not write
outside the
box
3 Circle the number that is written in standard form.
[1 mark]
0.9 × 10⁻³ 6 × 100.5 5.2 × 10⁻⁴ 12 × 107
4 Circle the expression that has the largest value when a < –1
[1 mark]
1
a a a2 a3
2
Turn over for the next question
4
Turn over ►
*03*
IB/M/Jun20/8300/2H
, 4
Do not write
outside the
box
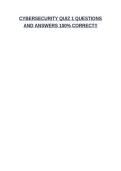
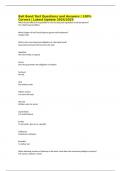
5 The time students spent watching TV was recorded.
The table shows the average daily time per student each year from 2012 to 2019
Year 2012 2013 2014 2015 2016 2017 2018 2019
Time (minutes) 157 148 138 124 113 100 90 82
A time series graph is drawn to represent the data.
The first four points have been plotted.
*04*
IB/M/Jun20/8300/2H
Paper 2 Calculator QP 2021
Please write clearly in block capitals.
Centre number Candidate number
Surname
Forename(s)
Candidate signature
I declare this is my own work.
GCSE
MATHEMATICS
Higher Tier Paper 2 Calculator
H
Thursday 4 June 2020 Morning Time allowed: 1 hour 30 minutes
Materials For Examiner’s Use
For this paper you must have:
Pages Mark
• a calculator
• mathematical instruments. 2–3
4–5
Instructions
6–7
• Use black ink or black ball-point pen. Draw diagrams in pencil.
8–9
• Fill in the boxes at the top of this page.
• Answer all questions. 10–11
• You must answer the questions in the spaces provided. Do not write 12–13
outside the box around each page or on blank pages. 14–15
• If you need extra space for your answer(s), use the lined pages at the end of
16–17
this book. Write the question number against your answer(s).
• Do all rough work in this book. Cross through any work you do not want to 18–19
be marked. 20–21
22–23
Information
24–25
• The marks for questions are shown in brackets.
26–27
• The maximum mark for this paper is 80.
• You may ask for more answer paper, graph paper and tracing paper. 28–29
These must be tagged securely to this answer book.
TOTAL
Advice
In all calculations, show clearly how you work out your answer.
*Jun2083002H01*
IB/M/Jun20/E7 8300/2H
, 2
Do not write
outside the
Answer all questions in the spaces provided. box
1 Which of these is a correct identity?
Circle your answer.
[1 mark]
x + 4x ≡ 5x 6x ≡ 18 2x + 1 ≡ 7 7x + 9 ≡ x
2
Not drawn
accurately
Circle the reason why these triangles are congruent.
[1 mark]
RHS ASA SSS SAS
*02*
IB/M/Jun20/8300/2H
, 3
Do not write
outside the
box
3 Circle the number that is written in standard form.
[1 mark]
0.9 × 10⁻³ 6 × 100.5 5.2 × 10⁻⁴ 12 × 107
4 Circle the expression that has the largest value when a < –1
[1 mark]
1
a a a2 a3
2
Turn over for the next question
4
Turn over ►
*03*
IB/M/Jun20/8300/2H
, 4
Do not write
outside the
box
5 The time students spent watching TV was recorded.
The table shows the average daily time per student each year from 2012 to 2019
Year 2012 2013 2014 2015 2016 2017 2018 2019
Time (minutes) 157 148 138 124 113 100 90 82
A time series graph is drawn to represent the data.
The first four points have been plotted.
*04*
IB/M/Jun20/8300/2H