Samenvatting GZW1026
Samenvatting course notes per week en uitwerking huiswerkopdrachten seminars
,Aantekeningen Course notes
Chapter 1 – exploratory data analysis: summarizing and describing data
1.1
variable: a label name of a characteristic in which a subject is different from another subject
(subject specific). Label= hair colour, variables can be brown, blond etc. those characteristics
are categories.
There are 2 types of variables:
- Qualitative/categorical variables → nominal and ordinal
- Quantitative/numeric variables → interval and ratio
Nominal variables → scores intended to distinguish between different categories →
scores itself don’t have meaning.
- Categories are not ordered
- Space between scores doesn’t have any meaning
- Score 2 for example isn’t worth twice as much as score one
Example= hair colour
Ordinal variables → same as nominal variables but categories are ordered. Ex. Level of
education or SEC
- Categories are ordered
- Space between scores doesn’t have any meaning
- Score 2 isn’t worth twice as much as 1
Interval variables → same as ordinal but the scores have some objective meaning. Ex.
Level of IQ or temperature
- Same information as nominal and ordinal plus the extra information that differences
between scores can be meaningfully interpreted
- But twice the score doesn’t necessarily mean double the amount of something. Ex. 20
degrees isn’t twice as hot as 10 degrees. Because there is no natural 0 point, 0 degrees has
been chosen bc of freezing point of water
Ratio variables → zero point is not chosen but represents a fixed zero value → there are
no negative values possible. Ex. Age, number of siblings.
- Double the score is also double the amount of age, siblings etc.
- Number of siblings Is discrete and not continuous so better to refer to ratio as quantitative
instead of continuous.
Type of variable also determines which statistical technique can be used.
,1.2
You want to describe and summarize the most important characteristics of your data.
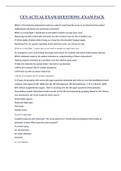
Frequency table:
-
Vertically= columns with scores, frequencies, percentage, cumulative percentage
-
Horizontally= rows representing the score of eacht group of subjects with the score in
column 1. Ex. Score 2 is scored by 3 students (frequency is 3), which is 3/24 → 12,5%
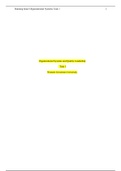
Bar chart: usually for qualitative variables
- Vertical axis= frequency
- Horizontal axis= scores
, Blank space between bars mean that there is no meaning for the scores in relation to each
other in terms of value. Ex. Different political parties. They are different categories.
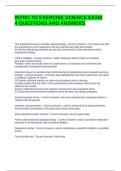
Pie chart
Pie= full population, the slices of the pie should be proportional to the proportions of the
results, used when you have different categories.
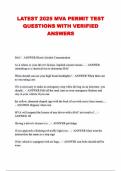
Histogram: usually for quantitative variables/data
Bars/scores are connected, and notion of distance on x-axis. Width of each bar is
meaningful.
- Horizontal end points on first bar are 1,5-2,5 with 2,0 in the middle → width of each bar is 1.
- Each bar has a surface that is exactly equal to the frequency of the scores. Ex. There are more
subjects scoring lower than 5 bc the bars on the left are higher → more surface.
Grouping → when you have a sample of n=20 scores ranging from 3.8 to 15,., you can
group them in five classes. For histogram choose equal groups to have each bar the same
width.
For widths unequal to 1, surface of the bar is usual chosen to be equal to the frequency →
here 3, to accomplish this you divide the scores on the y-axis by 3.
Samenvatting course notes per week en uitwerking huiswerkopdrachten seminars
,Aantekeningen Course notes
Chapter 1 – exploratory data analysis: summarizing and describing data
1.1
variable: a label name of a characteristic in which a subject is different from another subject
(subject specific). Label= hair colour, variables can be brown, blond etc. those characteristics
are categories.
There are 2 types of variables:
- Qualitative/categorical variables → nominal and ordinal
- Quantitative/numeric variables → interval and ratio
Nominal variables → scores intended to distinguish between different categories →
scores itself don’t have meaning.
- Categories are not ordered
- Space between scores doesn’t have any meaning
- Score 2 for example isn’t worth twice as much as score one
Example= hair colour
Ordinal variables → same as nominal variables but categories are ordered. Ex. Level of
education or SEC
- Categories are ordered
- Space between scores doesn’t have any meaning
- Score 2 isn’t worth twice as much as 1
Interval variables → same as ordinal but the scores have some objective meaning. Ex.
Level of IQ or temperature
- Same information as nominal and ordinal plus the extra information that differences
between scores can be meaningfully interpreted
- But twice the score doesn’t necessarily mean double the amount of something. Ex. 20
degrees isn’t twice as hot as 10 degrees. Because there is no natural 0 point, 0 degrees has
been chosen bc of freezing point of water
Ratio variables → zero point is not chosen but represents a fixed zero value → there are
no negative values possible. Ex. Age, number of siblings.
- Double the score is also double the amount of age, siblings etc.
- Number of siblings Is discrete and not continuous so better to refer to ratio as quantitative
instead of continuous.
Type of variable also determines which statistical technique can be used.
,1.2
You want to describe and summarize the most important characteristics of your data.
Frequency table:
-
Vertically= columns with scores, frequencies, percentage, cumulative percentage
-
Horizontally= rows representing the score of eacht group of subjects with the score in
column 1. Ex. Score 2 is scored by 3 students (frequency is 3), which is 3/24 → 12,5%
Bar chart: usually for qualitative variables
- Vertical axis= frequency
- Horizontal axis= scores
, Blank space between bars mean that there is no meaning for the scores in relation to each
other in terms of value. Ex. Different political parties. They are different categories.
Pie chart
Pie= full population, the slices of the pie should be proportional to the proportions of the
results, used when you have different categories.
Histogram: usually for quantitative variables/data
Bars/scores are connected, and notion of distance on x-axis. Width of each bar is
meaningful.
- Horizontal end points on first bar are 1,5-2,5 with 2,0 in the middle → width of each bar is 1.
- Each bar has a surface that is exactly equal to the frequency of the scores. Ex. There are more
subjects scoring lower than 5 bc the bars on the left are higher → more surface.
Grouping → when you have a sample of n=20 scores ranging from 3.8 to 15,., you can
group them in five classes. For histogram choose equal groups to have each bar the same
width.
For widths unequal to 1, surface of the bar is usual chosen to be equal to the frequency →
here 3, to accomplish this you divide the scores on the y-axis by 3.