GATech OMS - Intro Analytics Modeling - ISYE-6501
Week3 - Homework 3
Carlos André da Costa Sol
September 10th, 2019
Question 5.1
Using crime data from the file uscrime.txt
(http://www.statsci.org/data/general/uscrime.txt, description at
http://www.statsci.org/data/general/uscrime.html), test to see whether there are any
outliers in the last column (number of crimes per 100,000 people). Use the
grubbs.test function in the outliers package in R.
Answer:
Firstly, I explore data using summary, p-value and box-plot graph.
The summary of this column (df$Crime) is:
summary(df$Crime)
Min. 1st Qu. Median Mean 3rd Qu. Max.
342.0 658.5 831.0 905.1 1057.5 1993.0
The p-value is: 0.07887486
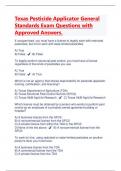
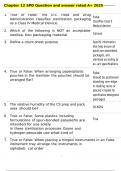
The Box-plot graph shows some potential outliers:
, Then, using Grubbs test to realize about the outlier, it shows that the highest value
1993 is an outlier.
Grubbs test for one outlier
data: crimes
G = 2.81287, U = 0.82426, p-value = 0.07887
alternative hypothesis: highest value 1993 is an outlier
Ansd also, exploring the column data again, we see that 1993 is the clearest outlier,
with 1969 being a close second.
> df$Crime[0:10]
[1] 791 1635 578 1969 1234 682 963 1555 856 705
Code:
File HW3_V5.R question 5.1 has complete code to solve the case. And is copied
here.
find_outlier = function(data, col_x){
#test to see whether there are any outliers in the last column (number of crimes per
100,000 people)
crimes <- as.numeric (col_x)
crime_result <- grubbs.test(crimes)
return (crime_result)
}
df <- read.delim("~/Homework/L5-6/HW3/uscrime.txt", header=TRUE)
#find and see outlier
auxr <- find_outlier(df, df$Crime)
# Verify statiscts summary and visualize
summary(df$Crime)
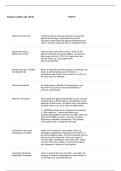
plot(df$Crime)
Week3 - Homework 3
Carlos André da Costa Sol
September 10th, 2019
Question 5.1
Using crime data from the file uscrime.txt
(http://www.statsci.org/data/general/uscrime.txt, description at
http://www.statsci.org/data/general/uscrime.html), test to see whether there are any
outliers in the last column (number of crimes per 100,000 people). Use the
grubbs.test function in the outliers package in R.
Answer:
Firstly, I explore data using summary, p-value and box-plot graph.
The summary of this column (df$Crime) is:
summary(df$Crime)
Min. 1st Qu. Median Mean 3rd Qu. Max.
342.0 658.5 831.0 905.1 1057.5 1993.0
The p-value is: 0.07887486
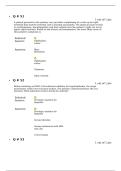
The Box-plot graph shows some potential outliers:
, Then, using Grubbs test to realize about the outlier, it shows that the highest value
1993 is an outlier.
Grubbs test for one outlier
data: crimes
G = 2.81287, U = 0.82426, p-value = 0.07887
alternative hypothesis: highest value 1993 is an outlier
Ansd also, exploring the column data again, we see that 1993 is the clearest outlier,
with 1969 being a close second.
> df$Crime[0:10]
[1] 791 1635 578 1969 1234 682 963 1555 856 705
Code:
File HW3_V5.R question 5.1 has complete code to solve the case. And is copied
here.
find_outlier = function(data, col_x){
#test to see whether there are any outliers in the last column (number of crimes per
100,000 people)
crimes <- as.numeric (col_x)
crime_result <- grubbs.test(crimes)
return (crime_result)
}
df <- read.delim("~/Homework/L5-6/HW3/uscrime.txt", header=TRUE)
#find and see outlier
auxr <- find_outlier(df, df$Crime)
# Verify statiscts summary and visualize
summary(df$Crime)
plot(df$Crime)