Week 8 Assignment: Predictions Using Linear Regression
Make predictions using a line of best fit
Question
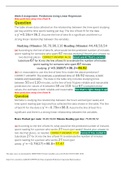
The table shows data collected on the relationship between the time spent studying
per day and the time spent reading per day. The line of best fit for the data
is yˆ=0.16x+36.2. Assume the line of best fit is significant and there is a
strong linear relationship between the variables.
Studying (Minutes) 50,70,90,110 Reading (Minutes) 44,48,50,54
(a) According to the line of best fit, what would be the predicted number of minutes
spent reading for someone who spent 67 minutes studying? Round your answer to
two decimal places. CORRECT ANSWER: 46.92. Great work! That's correct.
Substitute 67 for x into the line of best fit to estimate the number of minutes
spent reading for someone who spent 67 minutes
studying: yˆ=0.16(67)+36.2=46.92.
(b) Is it reasonable to use this line of best fit to make the above prediction?
CORRECT ANSWER: The estimate, a predicted time of 46.92 minutes, is both
reliable and reasonable. The data in the table only includes studying times
between 50 and 110 minutes, so the line of best fit gives reliable and reasonable
predictions for values of x between 50 and 110. Since 67 is between these
values, the estimate is both reliable and reasonable. Yes that's right. Keep it up!
Make predictions using a line of best fit
Question
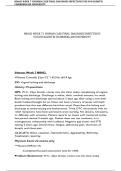
Michelle is studying the relationship between the hours worked (per week) and
time spent reading (per day) and has collected the data shown in the table. The line
of best fit for the data is yˆ=−0.79x+98.8. Assume the line of best fit is
significant and there is a strong linear relationship between the variables.
Hours Worked (per week) 30,40,50,60 Minutes Reading (per day) 75,68,58,52
(a) According to the line of best fit, what would be the predicted number of minutes
spent reading for a person who works 27 hours (per week)? Round your answer to
two decimal places, as needed. CORRECT ANSWER: 77.47 Correct! You nailed it.
Substitute 27 for x into the line of best fit to estimate the number of minutes
spent reading for a person who works 27 hours (per
week): yˆ=−0.79(27)+98.8=77.47.
This study source was downloaded by 100000770861734 from CourseHero.com on 02-09-2022 10:08:35 GMT -06:00
https://www.coursehero.com/file/60141909/Week-8-Stats-Assignment-Predictions-Using-Linear-Regressiondocx/
Make predictions using a line of best fit
Question
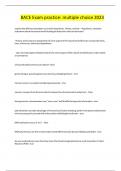
The table shows data collected on the relationship between the time spent studying
per day and the time spent reading per day. The line of best fit for the data
is yˆ=0.16x+36.2. Assume the line of best fit is significant and there is a
strong linear relationship between the variables.
Studying (Minutes) 50,70,90,110 Reading (Minutes) 44,48,50,54
(a) According to the line of best fit, what would be the predicted number of minutes
spent reading for someone who spent 67 minutes studying? Round your answer to
two decimal places. CORRECT ANSWER: 46.92. Great work! That's correct.
Substitute 67 for x into the line of best fit to estimate the number of minutes
spent reading for someone who spent 67 minutes
studying: yˆ=0.16(67)+36.2=46.92.
(b) Is it reasonable to use this line of best fit to make the above prediction?
CORRECT ANSWER: The estimate, a predicted time of 46.92 minutes, is both
reliable and reasonable. The data in the table only includes studying times
between 50 and 110 minutes, so the line of best fit gives reliable and reasonable
predictions for values of x between 50 and 110. Since 67 is between these
values, the estimate is both reliable and reasonable. Yes that's right. Keep it up!
Make predictions using a line of best fit
Question
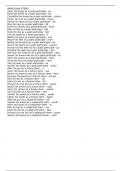
Michelle is studying the relationship between the hours worked (per week) and
time spent reading (per day) and has collected the data shown in the table. The line
of best fit for the data is yˆ=−0.79x+98.8. Assume the line of best fit is
significant and there is a strong linear relationship between the variables.
Hours Worked (per week) 30,40,50,60 Minutes Reading (per day) 75,68,58,52
(a) According to the line of best fit, what would be the predicted number of minutes
spent reading for a person who works 27 hours (per week)? Round your answer to
two decimal places, as needed. CORRECT ANSWER: 77.47 Correct! You nailed it.
Substitute 27 for x into the line of best fit to estimate the number of minutes
spent reading for a person who works 27 hours (per
week): yˆ=−0.79(27)+98.8=77.47.
This study source was downloaded by 100000770861734 from CourseHero.com on 02-09-2022 10:08:35 GMT -06:00
https://www.coursehero.com/file/60141909/Week-8-Stats-Assignment-Predictions-Using-Linear-Regressiondocx/