Market Models summary of Lectures and Papers 21/22
Lectures Week 1
What is a model?
A stylized representation of reality. A model will never be perfect, a model that will explain
everything does not exist.
What is the goal of a model?
Understand the reality.
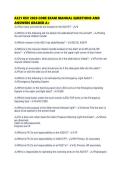
Basic elements of every model ->
3 types of models ->
1. Iconic models ->
Resemble reality but use other materials or another scale – for example to capture
design ideas. Examples: sketches, scale models. (This kind of models we do not use in
MM)
2. Analog models ->
Describe specific characteristics of an idea or system but do not contain details. Do
not resemble reality but are helpful in analyzing its functions. (Flow charts)(Not
interesting for MM)
3. Symbolic models ->
Represent ideas using code (for example: numbers and formulas) which are abstract
representations of reality. Example: (SCAN-Pro model).
Why models?
- Forces one to abstract away from details. (Find systematic patterns in the multiple
observations)
- Puts focus on the key elements only (first think about the important elements of the
model)
- Less ad-hoc than one-time analysis (since you search for systematic behavior how
people respond to for example a price discount)
, - Allows us to Include more than one factor simultaneously (check effectiveness of
‘above the line’ versus ‘below the line’ campaigns)
- Can be used to describe/predict or prescribe and is not limited to observed cases.
Why not always models?
- To time consuming (takes a lot of time)
- Data availability, if there is not enough data, making a model is not useful.
When use models?
- Design step: What combination of products is an important driver of customer value?
- Optimize step: Whom to target with what proposition?
- Evaluate: What media channel is more effective in which segment on what moment?
The four steps of marketing model building (book & course)
1. Specification -> Come up with a (regression) formula. That captures, based on theory
or earlier research the effect of (marketing) phenomena and how it is influenced by
other variables.
2. Estimation -> Obtaining estimates for B0 and B1 (parameters) that are present in the
formula of the specification step. How big is the intercept and the responds
coefficient?
3. Validation -> Checking the assumptions that we assume for doing the estimations. Is
normality satisfied? Making sure that we have reliable outcomes.
4. Use
Week 2 lectures: Specification 1.
Important Questions of Quiz. -> none.
Model specification exists of 5 steps:
1. Model types
2. Model elements
3. Model criteria
4. Model choices
5. Model assumptions
1. Model types
A: intended use, the first way to classify a model. 3 forms:
- Descriptive: Looking back in time and observe what happened.
- Predictive: Looking ahead what is next, to anticipate on that.
- Normative (prescriptive): If you now wat is going to happen, what decisions should I
take?
Difference between descriptive and predictive models ->
- Formulas are quite similar, but interpretation is usually different.
- At predictive: Focus on the left side of the formula since you would like the outcome.
The right-hand side is less important and could even be a black box.
, - When descriptive: you would like to get insights
of the variable’s insight the Blackbox. Since you
are interested in the betas of the variables and
would like to know which x variables are driving
the Y variable.
B: Level of demand, the second way to classify a model:
- Product class/form sales/industry sales
- Brand sales
- Market share
C: The amount of behavioral detail: (Not much behavioral detail in Lemonade model)
- No detail
- Some detail
- Substantial amount
2. Model elements:
Elements:
- Dependent and independent variables at single equation models
- Endogenous and exogenous variables at system of equations (Endogenous variables
are determined inside the system, exogenous variables are determined outside the
system)(out of scope for this course, only remember the differences).
- Disturbance term
- Mathematical form of relationship between variables
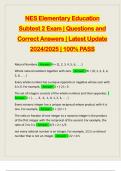
1. Dependent and independent variables:
Single equation model ^, which is the focus of MM.
Disturbance term ->
To pick up whatever is not picked up by the explanatory(predictor) variables (systematic
part) that you have in the model. The part where the random variation is entering the model
(the predictor variables are the systematic behavior of the model, X variables explaining Y).
So, if we disentangle the variation of Y, its partly determined by the systematic part of the
formula, namely how does the Y respond to the X variables that are included in the model.
And a random component with is the disturbance term.
Everything that is wrong in the model ends up in the disturbance term, but also other factors
are considered here:
, - Random error: Consumers do not always behave rationally. Different in what theory
expect them to do.
- Measurement error: Due to aggregating on weekly level. Since you need to average
some variables there could be some measurement error.
- Missing variables: Not all possible effects are included in the data.
- Specification error: When you assume all variables are linear, but that is not the case
in your model. Advertising is not linear for example, it is decreasing returns to scale.
When you add this non-linear variable in a linear model there will be some error
which end up in the disturbance term.
Mathematical form ->
1. Models linear in parameters and variables.
2. Models linear in parameters, not in variables.
3. Models nonlinear in parameters but linearizable.
4. Models nonlinear in parameters and not linearizable.
5. Nonparametric models: no parameters.
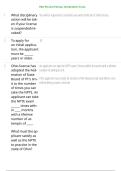
1. Models linear in parameters and variables: Linear additive model.
Y depends on several X variables. Each X variable is multiplied with a fixed number: Beta,
which is different for each of the variables, but it doesn’t change over time. Properties:
- Linear: Every time we increase the corresponding X-variable with 1 unit the Y will go
up with the same amount (Beta 1 when looking at X1).
- Additive: The effect of X1 is added to the other X-variables effects.
- Why this model? We know everything there is about this model, if the assumption
for applying this model holds, we know that OLS is the optimal way of estimating
such a model. If we can apply this model, we have a preference for it.
- Downside: It assumes that everything is linear and everything is additive which is in
many cases not a viable assumption. (Think of the advertising decreasing returns to
scale example)
- Downside explained in the book: The linear additive model assumes no interactions
between the X-variables. Interactions between the X-variables occur when the effect
of one X-variable on the Y-variable depends on the level of the other X-variable. In
such cases, the latter X-variable is said to moderate the effect of the first x-variable
on y.
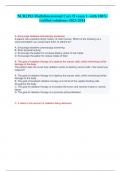
2. Model linear in parameters, but not in variables.
With this model you transform the X-variables before they enter the model. By taking the
square root, log(LN) or square. When do so, we accommodate for the effect there are
decreasing returns of scale. In this way the variables can be curved.
Lectures Week 1
What is a model?
A stylized representation of reality. A model will never be perfect, a model that will explain
everything does not exist.
What is the goal of a model?
Understand the reality.
Basic elements of every model ->
3 types of models ->
1. Iconic models ->
Resemble reality but use other materials or another scale – for example to capture
design ideas. Examples: sketches, scale models. (This kind of models we do not use in
MM)
2. Analog models ->
Describe specific characteristics of an idea or system but do not contain details. Do
not resemble reality but are helpful in analyzing its functions. (Flow charts)(Not
interesting for MM)
3. Symbolic models ->
Represent ideas using code (for example: numbers and formulas) which are abstract
representations of reality. Example: (SCAN-Pro model).
Why models?
- Forces one to abstract away from details. (Find systematic patterns in the multiple
observations)
- Puts focus on the key elements only (first think about the important elements of the
model)
- Less ad-hoc than one-time analysis (since you search for systematic behavior how
people respond to for example a price discount)
, - Allows us to Include more than one factor simultaneously (check effectiveness of
‘above the line’ versus ‘below the line’ campaigns)
- Can be used to describe/predict or prescribe and is not limited to observed cases.
Why not always models?
- To time consuming (takes a lot of time)
- Data availability, if there is not enough data, making a model is not useful.
When use models?
- Design step: What combination of products is an important driver of customer value?
- Optimize step: Whom to target with what proposition?
- Evaluate: What media channel is more effective in which segment on what moment?
The four steps of marketing model building (book & course)
1. Specification -> Come up with a (regression) formula. That captures, based on theory
or earlier research the effect of (marketing) phenomena and how it is influenced by
other variables.
2. Estimation -> Obtaining estimates for B0 and B1 (parameters) that are present in the
formula of the specification step. How big is the intercept and the responds
coefficient?
3. Validation -> Checking the assumptions that we assume for doing the estimations. Is
normality satisfied? Making sure that we have reliable outcomes.
4. Use
Week 2 lectures: Specification 1.
Important Questions of Quiz. -> none.
Model specification exists of 5 steps:
1. Model types
2. Model elements
3. Model criteria
4. Model choices
5. Model assumptions
1. Model types
A: intended use, the first way to classify a model. 3 forms:
- Descriptive: Looking back in time and observe what happened.
- Predictive: Looking ahead what is next, to anticipate on that.
- Normative (prescriptive): If you now wat is going to happen, what decisions should I
take?
Difference between descriptive and predictive models ->
- Formulas are quite similar, but interpretation is usually different.
- At predictive: Focus on the left side of the formula since you would like the outcome.
The right-hand side is less important and could even be a black box.
, - When descriptive: you would like to get insights
of the variable’s insight the Blackbox. Since you
are interested in the betas of the variables and
would like to know which x variables are driving
the Y variable.
B: Level of demand, the second way to classify a model:
- Product class/form sales/industry sales
- Brand sales
- Market share
C: The amount of behavioral detail: (Not much behavioral detail in Lemonade model)
- No detail
- Some detail
- Substantial amount
2. Model elements:
Elements:
- Dependent and independent variables at single equation models
- Endogenous and exogenous variables at system of equations (Endogenous variables
are determined inside the system, exogenous variables are determined outside the
system)(out of scope for this course, only remember the differences).
- Disturbance term
- Mathematical form of relationship between variables
1. Dependent and independent variables:
Single equation model ^, which is the focus of MM.
Disturbance term ->
To pick up whatever is not picked up by the explanatory(predictor) variables (systematic
part) that you have in the model. The part where the random variation is entering the model
(the predictor variables are the systematic behavior of the model, X variables explaining Y).
So, if we disentangle the variation of Y, its partly determined by the systematic part of the
formula, namely how does the Y respond to the X variables that are included in the model.
And a random component with is the disturbance term.
Everything that is wrong in the model ends up in the disturbance term, but also other factors
are considered here:
, - Random error: Consumers do not always behave rationally. Different in what theory
expect them to do.
- Measurement error: Due to aggregating on weekly level. Since you need to average
some variables there could be some measurement error.
- Missing variables: Not all possible effects are included in the data.
- Specification error: When you assume all variables are linear, but that is not the case
in your model. Advertising is not linear for example, it is decreasing returns to scale.
When you add this non-linear variable in a linear model there will be some error
which end up in the disturbance term.
Mathematical form ->
1. Models linear in parameters and variables.
2. Models linear in parameters, not in variables.
3. Models nonlinear in parameters but linearizable.
4. Models nonlinear in parameters and not linearizable.
5. Nonparametric models: no parameters.
1. Models linear in parameters and variables: Linear additive model.
Y depends on several X variables. Each X variable is multiplied with a fixed number: Beta,
which is different for each of the variables, but it doesn’t change over time. Properties:
- Linear: Every time we increase the corresponding X-variable with 1 unit the Y will go
up with the same amount (Beta 1 when looking at X1).
- Additive: The effect of X1 is added to the other X-variables effects.
- Why this model? We know everything there is about this model, if the assumption
for applying this model holds, we know that OLS is the optimal way of estimating
such a model. If we can apply this model, we have a preference for it.
- Downside: It assumes that everything is linear and everything is additive which is in
many cases not a viable assumption. (Think of the advertising decreasing returns to
scale example)
- Downside explained in the book: The linear additive model assumes no interactions
between the X-variables. Interactions between the X-variables occur when the effect
of one X-variable on the Y-variable depends on the level of the other X-variable. In
such cases, the latter X-variable is said to moderate the effect of the first x-variable
on y.
2. Model linear in parameters, but not in variables.
With this model you transform the X-variables before they enter the model. By taking the
square root, log(LN) or square. When do so, we accommodate for the effect there are
decreasing returns of scale. In this way the variables can be curved.