1
,Business research methods
Table of contents
Chapter one: logistic regression ..................................................................................................................................... 4
1.1 introduction .................................................................................................................................................... 4
1.1.1 Logistic regression.......................................................................................................................................... 4
1.1.2 LR example (data credit) ................................................................................................................................ 4
1.1.3 LR example (prcancer) ................................................................................................................................... 5
1.2 The logistic regression model ............................................................................................................................... 5
1.2.1 General logistic regression model .................................................................................................................. 7
1.2.2. Explanatory variables .................................................................................................................................... 7
1.3 Regression coefficients ......................................................................................................................................... 8
1.3.1 Estimation method ........................................................................................................................................ 8
1.3.2 Interpretation: in terms of probabilities ........................................................................................................ 9
1.3.3 Odds ............................................................................................................................................................... 9
1.3.4 odds interpretation ...................................................................................................................................... 11
1.4 hypothesis testing ............................................................................................................................................... 12
1.4.1 Hypothesis test: likelihood ratio test ........................................................................................................... 12
1.4.2 Significant variable ? H0: βi=0 versus H1: βi≠0 .............................................................................................. 13
1.5 quality ................................................................................................................................................................. 15
1.5.1 Classifications............................................................................................................................................... 15
1.5.2 Hosmer and Lemeshow test ........................................................................................................................ 16
1.6 assumptions ........................................................................................................................................................ 17
1.6.1 linearity ........................................................................................................................................................ 17
1.6.2 outliers ......................................................................................................................................................... 17
1.6.3 QMC ............................................................................................................................................................. 18
1.6.4 Quasi-complete separation (QCS) ................................................................................................................ 18
chapter two: factor analysis ......................................................................................................................................... 20
2.1 Correlation and factors ................................................................................................................................. 20
Overview of factor analysis ................................................................................................................................... 21
2.1.1 Correlation matrix ........................................................................................................................................ 21
2.2 factors ................................................................................................................................................................. 24
2.2.1 Constructing factors (factor model: x=af + u) .............................................................................................. 24
2.2.2 How many factors do we need?................................................................................................................... 27
2.2.3 How good is the factor model? .................................................................................................................... 31
2.3 interpretation ..................................................................................................................................................... 33
2
, 2.4 Factor scores ....................................................................................................................................................... 36
2.4.1 How can we determine factor scores? ......................................................................................................... 37
2.4.2 Examples ...................................................................................................................................................... 37
2.5 Summary of factor analysis: what to mention .................................................................................................... 39
2.6 Types of factor analysis ....................................................................................................................................... 39
2.6.1 Exploratory factor analysis ........................................................................................................................... 39
2.6.2 Confirmatory factor analysis ........................................................................................................................ 39
chapter three: reliability analysis.................................................................................................................................. 39
3.1 Use of reliability analysis..................................................................................................................................... 39
3.2 Scale .................................................................................................................................................................... 40
3.2.1 Coding of the items ...................................................................................................................................... 40
3.2.2 Number of items .......................................................................................................................................... 40
3.2.3 Reliability of a scale ...................................................................................................................................... 41
3.3 Example .............................................................................................................................................................. 43
chapter four: cluster analysis ........................................................................................................................................ 44
4.1 Cluster analysis methods .................................................................................................................................... 44
4.1.1 Hierarchical clustering ................................................................................................................................. 44
4.1.2 K-means clustering ....................................................................................................................................... 50
4.2 Clustering summary ............................................................................................................................................ 52
3
, Chapter one: logistic regression
1.1 introduction
Y = 0 + 1 X1 + 2 X 2 + ... + p X p +
Linear model:
E.g. education/ income
1.1.1 Logistic regression
Many empirical problems however imply a dummy variable as the dependent variable
Examples:
• Company is profitable (1) or unprofitable (0)
• Customers of a bank are solvent (1) or not (0)
• Company is into corporate social responsibility (1) or not (0)
• Customer responds to promotion (1) or not (0)
• Someone develops a heart disease (1) or not (0)
• You win the elections (1) or not (0)
We cannot apply linear regression analysis
1.1.2 LR example (data credit)
Solvency of a customer (data_credit.sav)
Research question: which charateristics determine whether someone is a good or bad payer?
Population: customers of a leasing company
Sample: 1000 customers
Dependent variable Y: good = 1 good payer, solvent // 0 bad payer, not solvent
Explanatory variables:
• Age: age in years
• Estate: owner of estate (1=yes; 0=no)
• Marital status: married, living together, single
• → dummies
o m1:1 when married, 0 otherwise
o m2: 1 when living together, 0 otherwise
o reference: single
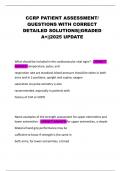
Does the age of the respondent have an impact on the solvency? → no clear impact but linear regression?
4
,Business research methods
Table of contents
Chapter one: logistic regression ..................................................................................................................................... 4
1.1 introduction .................................................................................................................................................... 4
1.1.1 Logistic regression.......................................................................................................................................... 4
1.1.2 LR example (data credit) ................................................................................................................................ 4
1.1.3 LR example (prcancer) ................................................................................................................................... 5
1.2 The logistic regression model ............................................................................................................................... 5
1.2.1 General logistic regression model .................................................................................................................. 7
1.2.2. Explanatory variables .................................................................................................................................... 7
1.3 Regression coefficients ......................................................................................................................................... 8
1.3.1 Estimation method ........................................................................................................................................ 8
1.3.2 Interpretation: in terms of probabilities ........................................................................................................ 9
1.3.3 Odds ............................................................................................................................................................... 9
1.3.4 odds interpretation ...................................................................................................................................... 11
1.4 hypothesis testing ............................................................................................................................................... 12
1.4.1 Hypothesis test: likelihood ratio test ........................................................................................................... 12
1.4.2 Significant variable ? H0: βi=0 versus H1: βi≠0 .............................................................................................. 13
1.5 quality ................................................................................................................................................................. 15
1.5.1 Classifications............................................................................................................................................... 15
1.5.2 Hosmer and Lemeshow test ........................................................................................................................ 16
1.6 assumptions ........................................................................................................................................................ 17
1.6.1 linearity ........................................................................................................................................................ 17
1.6.2 outliers ......................................................................................................................................................... 17
1.6.3 QMC ............................................................................................................................................................. 18
1.6.4 Quasi-complete separation (QCS) ................................................................................................................ 18
chapter two: factor analysis ......................................................................................................................................... 20
2.1 Correlation and factors ................................................................................................................................. 20
Overview of factor analysis ................................................................................................................................... 21
2.1.1 Correlation matrix ........................................................................................................................................ 21
2.2 factors ................................................................................................................................................................. 24
2.2.1 Constructing factors (factor model: x=af + u) .............................................................................................. 24
2.2.2 How many factors do we need?................................................................................................................... 27
2.2.3 How good is the factor model? .................................................................................................................... 31
2.3 interpretation ..................................................................................................................................................... 33
2
, 2.4 Factor scores ....................................................................................................................................................... 36
2.4.1 How can we determine factor scores? ......................................................................................................... 37
2.4.2 Examples ...................................................................................................................................................... 37
2.5 Summary of factor analysis: what to mention .................................................................................................... 39
2.6 Types of factor analysis ....................................................................................................................................... 39
2.6.1 Exploratory factor analysis ........................................................................................................................... 39
2.6.2 Confirmatory factor analysis ........................................................................................................................ 39
chapter three: reliability analysis.................................................................................................................................. 39
3.1 Use of reliability analysis..................................................................................................................................... 39
3.2 Scale .................................................................................................................................................................... 40
3.2.1 Coding of the items ...................................................................................................................................... 40
3.2.2 Number of items .......................................................................................................................................... 40
3.2.3 Reliability of a scale ...................................................................................................................................... 41
3.3 Example .............................................................................................................................................................. 43
chapter four: cluster analysis ........................................................................................................................................ 44
4.1 Cluster analysis methods .................................................................................................................................... 44
4.1.1 Hierarchical clustering ................................................................................................................................. 44
4.1.2 K-means clustering ....................................................................................................................................... 50
4.2 Clustering summary ............................................................................................................................................ 52
3
, Chapter one: logistic regression
1.1 introduction
Y = 0 + 1 X1 + 2 X 2 + ... + p X p +
Linear model:
E.g. education/ income
1.1.1 Logistic regression
Many empirical problems however imply a dummy variable as the dependent variable
Examples:
• Company is profitable (1) or unprofitable (0)
• Customers of a bank are solvent (1) or not (0)
• Company is into corporate social responsibility (1) or not (0)
• Customer responds to promotion (1) or not (0)
• Someone develops a heart disease (1) or not (0)
• You win the elections (1) or not (0)
We cannot apply linear regression analysis
1.1.2 LR example (data credit)
Solvency of a customer (data_credit.sav)
Research question: which charateristics determine whether someone is a good or bad payer?
Population: customers of a leasing company
Sample: 1000 customers
Dependent variable Y: good = 1 good payer, solvent // 0 bad payer, not solvent
Explanatory variables:
• Age: age in years
• Estate: owner of estate (1=yes; 0=no)
• Marital status: married, living together, single
• → dummies
o m1:1 when married, 0 otherwise
o m2: 1 when living together, 0 otherwise
o reference: single
Does the age of the respondent have an impact on the solvency? → no clear impact but linear regression?
4