Lecture 1: Introduction 30/08/2021
To do:
- Check Canvas & any assignments
- Prepare the tutorials at home, check Canvas
-
6 weeks
Final week is a Q&A session
3 lab sessions, not mandatory, but very important
Exam in SPSS, and a written exam.
Important sites:
www.bps.uvt.nl
www.europeansocialsurvey.org > for data sets
We use statistics to:
- Describe/summarize data: descriptive statistics
o Reduce the data to understandable pieces of information
- Drawing inferences about populations: inferential statistics
o In practice: we only have observations on a selection of cases from a larger
population; we need to evaluate whether the results in the sample are
generalizable to the population
o Sampling
- Studying complex multivariate relationships: statistical modeling
o In practice, we are interested in relationships between several variables. For
example, to what extent does education predict healthy lifestyle, controlled
for income differences? Statistics help to uncover complex relations. > second
block of premaster.
Measurement levels
Measure things through interviews, questionnaires, etc.
3 types of measurement levels:
1. Nominal Data = numbers express group membership
- Example: Marital status:
o 1 = Single
o 2 = Married
o 3 = In a serious relationship, not married
o 4 = Not specified otherwise
- Nominal variables classifies cases into two or more categories. Categories must be
exhaustive (all possibilities should be covered) and mutually exclusive (every case
fits into one category and one category only).
2. Ordinal Data = numbers express an ordering (less/more)
- Example: Smoking intensity:
o 1= Never
o 2 = Occasionally
o 3 = Regularly
o 4 = Heavy
, - The moment you can see a logical ordering, it is not nominal anymore. Numbers
express more or less of a quantity, but the difference between 1 and 2 is not the
samen in quantity AANVULLEN VAN PRESENTATIE slide 11
3. Interval and Ratio (Scale-level)
- Data: numbers express differences in quantity using a common unit.
- AANVULLEN VAN PRESENTATIE slide 12
Interval- & ratio-level (divisions within scale data)
- Ratio level has a natural 0 point.
- Interval levels don’t have a natural 0 point. For example, in temperature, there it is
chosen, it is not natural. Fahrenheit is a different 0 degrees then in Celcius.
Scale is when you can say answer 1 is two times lower then 2. Ordinal: It’s not independent
numbers, it are categories.
Variables that are not nominal or ordinal are treated as scale-level variables.
AANVULLEN VAN PRESENTATIE slide 14
Always aim for the highest measurement level > Nominal > Ordinal > Scale
Data inspection
Every analysis starts with a data inspection; get a clear picture of the data
- Graphs, statistics, percentages, etc. > descriptive statistics
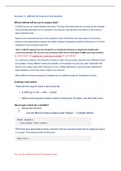
Bar Charts
Nominal
data
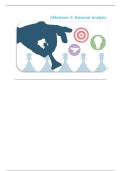
,Histogram
Scale data
Frequency distribution of age in
the picture
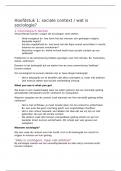
Scatterplots
By-variate: combination of 2 variables
, Frequency tables
Central Tendency > Mode, Median & Mean
- Mode/modus = the score that is observed most frequently
o If two scores are observed at the same frequency, it would be bimodal.
- Median = the score that separates the higher half of data from the lower half
- Mean (gemiddelde):
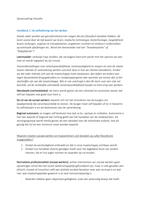
Deviation score = the difference between a score Xi and the Mean Score
Triangle =
average/mean (5)
3, 4 & 8 are the Xi
scores
i = 1 respondent
Standaarddeviatie in Dutch
To do:
- Check Canvas & any assignments
- Prepare the tutorials at home, check Canvas
-
6 weeks
Final week is a Q&A session
3 lab sessions, not mandatory, but very important
Exam in SPSS, and a written exam.
Important sites:
www.bps.uvt.nl
www.europeansocialsurvey.org > for data sets
We use statistics to:
- Describe/summarize data: descriptive statistics
o Reduce the data to understandable pieces of information
- Drawing inferences about populations: inferential statistics
o In practice: we only have observations on a selection of cases from a larger
population; we need to evaluate whether the results in the sample are
generalizable to the population
o Sampling
- Studying complex multivariate relationships: statistical modeling
o In practice, we are interested in relationships between several variables. For
example, to what extent does education predict healthy lifestyle, controlled
for income differences? Statistics help to uncover complex relations. > second
block of premaster.
Measurement levels
Measure things through interviews, questionnaires, etc.
3 types of measurement levels:
1. Nominal Data = numbers express group membership
- Example: Marital status:
o 1 = Single
o 2 = Married
o 3 = In a serious relationship, not married
o 4 = Not specified otherwise
- Nominal variables classifies cases into two or more categories. Categories must be
exhaustive (all possibilities should be covered) and mutually exclusive (every case
fits into one category and one category only).
2. Ordinal Data = numbers express an ordering (less/more)
- Example: Smoking intensity:
o 1= Never
o 2 = Occasionally
o 3 = Regularly
o 4 = Heavy
, - The moment you can see a logical ordering, it is not nominal anymore. Numbers
express more or less of a quantity, but the difference between 1 and 2 is not the
samen in quantity AANVULLEN VAN PRESENTATIE slide 11
3. Interval and Ratio (Scale-level)
- Data: numbers express differences in quantity using a common unit.
- AANVULLEN VAN PRESENTATIE slide 12
Interval- & ratio-level (divisions within scale data)
- Ratio level has a natural 0 point.
- Interval levels don’t have a natural 0 point. For example, in temperature, there it is
chosen, it is not natural. Fahrenheit is a different 0 degrees then in Celcius.
Scale is when you can say answer 1 is two times lower then 2. Ordinal: It’s not independent
numbers, it are categories.
Variables that are not nominal or ordinal are treated as scale-level variables.
AANVULLEN VAN PRESENTATIE slide 14
Always aim for the highest measurement level > Nominal > Ordinal > Scale
Data inspection
Every analysis starts with a data inspection; get a clear picture of the data
- Graphs, statistics, percentages, etc. > descriptive statistics
Bar Charts
Nominal
data
,Histogram
Scale data
Frequency distribution of age in
the picture
Scatterplots
By-variate: combination of 2 variables
, Frequency tables
Central Tendency > Mode, Median & Mean
- Mode/modus = the score that is observed most frequently
o If two scores are observed at the same frequency, it would be bimodal.
- Median = the score that separates the higher half of data from the lower half
- Mean (gemiddelde):
Deviation score = the difference between a score Xi and the Mean Score
Triangle =
average/mean (5)
3, 4 & 8 are the Xi
scores
i = 1 respondent
Standaarddeviatie in Dutch