Descriptive Statistics
Have a large amount of data, and you will need to organize it in an understandable
manner.
Will study numerical and graphical ways to describe and display data.
This area of statistics is called descriptive statistics.
Calculate and interpret measurements and graphs.
Statistical graph:
→ A tool that helps you learn about the shape or distribution of a sample or a
population.
→ More effective way of presenting data than a mass of numbers.
→ Can see where data values cluster and where there are only a few data
values.
Types of graphs that are used to summarize and organize data are the:
→ dot plot,
→ bar graph,
→ histogram,
→ stem-and-leaf plot,
→ frequency polygon (a type of broken line graph),
→ pie chart, and
→ the box plot.
1.1. Stem-and-Leaf Graphs (Stemplots), Line Graphs, and Bar
Graphs
The stem-and-leaf graph or stemplot:
→ Comes from the field of exploratory data analysis.
→ A good choice when the data sets are small.
→ To create the plot, divide each observation of data into a stem and a leaf.
→ The stem consists of the leading digit(s), while the leaf consists of a final
significant digit.
→ For example, 23 has stem two and leaf three. 432 has stem 43 and leaf two.
5,432 has stem 543 and leaf two. The decimal 9.3 has stem nine and leaf
three.
1
,Steps involved:
→ Write the stems in a vertical line from smallest to largest.
→ Draw a vertical line to the right of the stems. Then write the leaves in increasing
order next to their corresponding stem.
→ Make sure the leaves show a space between values, so that the exact data values
may be easily determined.
→ The frequency of data values for each stem provides information about the shape of
the distribution.
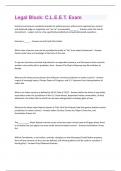
Example 1: Stem-and-leaf graph (Stemplot)
→ This is a quick way to graph data and gives an exact picture of the data.
→ Consider an overall pattern and any outliers.
→ An outlier is an observation of data that does not fit the rest of the data.
→ Sometimes called an extreme value.
→ When you graph an outlier, it will appear not to fit the pattern of the graph.
→ Some outliers are due to mistakes (writing 50 instead of 500), while others may
indicate that something unusual is happening, hence require background
information to explain outliers.
2
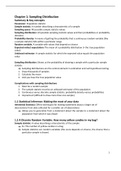
,Example 2:
Example 3:
A side-by-side stem-and-leaf plot allows a comparison of the two data sets in two
columns.
In a side-by-side stem-and-leaf plot, two sets of leaves share the same stem.
The leaves are to the left and the right of the stems.
Table 2.3 and Table 2.4 show the ages of presidents at their inauguration and at
their death.
Construct a side-by-side stem-and-leaf plot using these data.
3
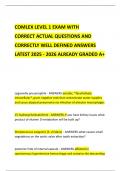
, Solution:
Notice that the leaf values
increase in order, from right to
left, for leaves shown to the left
of the stem, while the leaf values
increase in order from left to
right, for leaves shown to the
right of the stem.
4
Have a large amount of data, and you will need to organize it in an understandable
manner.
Will study numerical and graphical ways to describe and display data.
This area of statistics is called descriptive statistics.
Calculate and interpret measurements and graphs.
Statistical graph:
→ A tool that helps you learn about the shape or distribution of a sample or a
population.
→ More effective way of presenting data than a mass of numbers.
→ Can see where data values cluster and where there are only a few data
values.
Types of graphs that are used to summarize and organize data are the:
→ dot plot,
→ bar graph,
→ histogram,
→ stem-and-leaf plot,
→ frequency polygon (a type of broken line graph),
→ pie chart, and
→ the box plot.
1.1. Stem-and-Leaf Graphs (Stemplots), Line Graphs, and Bar
Graphs
The stem-and-leaf graph or stemplot:
→ Comes from the field of exploratory data analysis.
→ A good choice when the data sets are small.
→ To create the plot, divide each observation of data into a stem and a leaf.
→ The stem consists of the leading digit(s), while the leaf consists of a final
significant digit.
→ For example, 23 has stem two and leaf three. 432 has stem 43 and leaf two.
5,432 has stem 543 and leaf two. The decimal 9.3 has stem nine and leaf
three.
1
,Steps involved:
→ Write the stems in a vertical line from smallest to largest.
→ Draw a vertical line to the right of the stems. Then write the leaves in increasing
order next to their corresponding stem.
→ Make sure the leaves show a space between values, so that the exact data values
may be easily determined.
→ The frequency of data values for each stem provides information about the shape of
the distribution.
Example 1: Stem-and-leaf graph (Stemplot)
→ This is a quick way to graph data and gives an exact picture of the data.
→ Consider an overall pattern and any outliers.
→ An outlier is an observation of data that does not fit the rest of the data.
→ Sometimes called an extreme value.
→ When you graph an outlier, it will appear not to fit the pattern of the graph.
→ Some outliers are due to mistakes (writing 50 instead of 500), while others may
indicate that something unusual is happening, hence require background
information to explain outliers.
2
,Example 2:
Example 3:
A side-by-side stem-and-leaf plot allows a comparison of the two data sets in two
columns.
In a side-by-side stem-and-leaf plot, two sets of leaves share the same stem.
The leaves are to the left and the right of the stems.
Table 2.3 and Table 2.4 show the ages of presidents at their inauguration and at
their death.
Construct a side-by-side stem-and-leaf plot using these data.
3
, Solution:
Notice that the leaf values
increase in order, from right to
left, for leaves shown to the left
of the stem, while the leaf values
increase in order from left to
right, for leaves shown to the
right of the stem.
4