POPULATION HEALTH DATA BRIEF | 2021
Informatics for Transforming Nursing Care
April 22, 2021
Allegheny County, Pennsylvania
A. SOCIODEMOGRAPHIC PROFILE
1. Key Findings
● Adult obesity rates in Allegheny County are rising faster than state or national levels
● Air pollution and particulate matter are concerningly higher in Allegheny County than
in state or national levels
● Allegheny County has a very low percentage of individuals that are uninsured
classifying the county as a US top performer
● Allegheny County’s poverty level is higher than the national average
● Allegheny County is the 2nd worst Pennsylvania County for income inequality
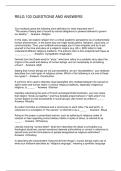
Note. This is a map of Allegheny County (Maps of World, n.d.).
2. Introductory paragraph
Data gathered from the US Census Bureau’s QuickFacts shows Allegheny County is a
densely populated part of the state of Pennsylvania and accounts for nearly 10% of the state’s
population. Population per square mile for the state of Pennsylvania is 283.9 persons per
square mile, while Allegheny County boasts 1,675.6 persons per square mile. The population
of Allegheny County is similar in diversity to that of the United States. 79.9 percent of
Allegheny County residents claim white alone as their ethnicity compared to the national
76.3 percent. Similarly, both Allegheny County and the United States contain 13.4 percent
black residents. Allegheny County’s population is slightly older than the national population.
While Allegheny County has only 18.6 percent of residents under the age of 18, the US
1
,population has 22.3 percent of residents under the age of 18. Likewise, Allegheny County has
more population over the age of 65 which includes 19.3 percent of residents, while the US
has only 16.5 percent. Allegheny County outperforms US high school graduation rates at
94.6 percent compared to the US 88 percent. Allegheny County boasts only 5 percent of
residents are uninsured in comparison to the US average of 9.5 percent. Allegheny County’s
population has a higher per capita income ($38,709) compared to the United States
($34,103); however, Allegheny County has a higher poverty level at 10.8 percent compared
to the US 10.5 percent indicating an issue of income inequality within the county (United
States Census Bureau, n.d.).
3. Sociodemographic Profile Table
Population Characteristics County United States
Population Estimates 1,216,045 328,745,538
Population Percent Change -0.6% 6.3%
Percent of Persons Under the Age of 18 18.6% 22.3%
Percent of Persons 65 Years and Over 19.3% 16.5%
Percent of Female Persons 51.6% 50.8%
Percent White alone 79.9% 76.3%
Percent Black or African American alone 13.4% 13.4%
Percent American Indian and Alaska Native alone 0.2% 1.3%
Percent Asian alone 4.2% 5.9%
Percent Native Hawaiian and Other Pacific N/A 0.2%
Islander alone
Percent Two or More Races 2.3% 2.8%
Percent Hispanic or Latino alone 2.3% 18.5%
Percent White alone, not Hispanic or Latino 78.1% 60.1%
Language Other Than English Spoken at Home, 7.5% 21.6%
Percent of persons 5 years +
Percent of Houses with a Computer 89.2% 90.3%
Percent with High School Graduate or Higher 94.6% 88.0%
Percent with a Disability, Under Age 65 Years 9.1% 8.6%
Percent without Health Insurance, Under Age 65 5.0% 9.5%
Years
Percent in Civilian Labor Force Age 16 Years+ 64.9% 63.0%
Percent of Females in Civilian Labor Force Age 60.2% 58.3%
2
, 16 Years+
12,756,157 2,040,441,2
Total Healthcare and Social Assistance Revenue
03
Total Retail Sales Per Capita $16,719 $13,443
Per Capita Income in the Past 12 Months $38,709 $34,103
Percent of Persons in Poverty 10.8% 10.5%
Population Per Square Mile 1,675.6 87.4
(United States Census Bureau, n.d.).
B. COUNTY HEALTH TRENDS & RANKINGS
1. Introductory Paragraph
In order to improve the health of a community, it is crucial to review the data of health facts
about the community. Once the data is gathered, it can be reviewed and analyzed to determine the
changes that are necessary to improve health. Only after data is gathered and analyzed can it be
used to develop an implementation plan for change.
Seven health trends for Allegheny County, Pennsylvania were collected using the County
Health Rankings and Roadmaps website that is supported by the Robert Wood Johnson Foundation.
The seven trends reviewed were: adult obesity, physical inactivity, uninsured, preventable hospital
stays, unemployment, violent crime, and air pollution-particulate matter. Adult obesity was chosen
due to its worsening trend. Physical inactivity and uninsured persons were chosen due to the county
being better than the national averages while continuing to improve. Preventable hospital stays and
unemployment were chosen due to the lack of changing trends. Violent crimes and air pollution
were chosen as they are at concerning levels although beginning to improve. The data in each
category was compared to the state data and national data (County Health Rankings & Roadmaps,
2021b).
2. Discussion of Health Trends
The Trend graphs reviewed from the County Health Rankings and Roadmaps website
allowed for easy visualization of comparing the health trends for county, state, and nation.
The visualized trends allow for easy determination of whether the county is improving,
3
Informatics for Transforming Nursing Care
April 22, 2021
Allegheny County, Pennsylvania
A. SOCIODEMOGRAPHIC PROFILE
1. Key Findings
● Adult obesity rates in Allegheny County are rising faster than state or national levels
● Air pollution and particulate matter are concerningly higher in Allegheny County than
in state or national levels
● Allegheny County has a very low percentage of individuals that are uninsured
classifying the county as a US top performer
● Allegheny County’s poverty level is higher than the national average
● Allegheny County is the 2nd worst Pennsylvania County for income inequality
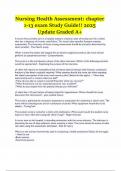
Note. This is a map of Allegheny County (Maps of World, n.d.).
2. Introductory paragraph
Data gathered from the US Census Bureau’s QuickFacts shows Allegheny County is a
densely populated part of the state of Pennsylvania and accounts for nearly 10% of the state’s
population. Population per square mile for the state of Pennsylvania is 283.9 persons per
square mile, while Allegheny County boasts 1,675.6 persons per square mile. The population
of Allegheny County is similar in diversity to that of the United States. 79.9 percent of
Allegheny County residents claim white alone as their ethnicity compared to the national
76.3 percent. Similarly, both Allegheny County and the United States contain 13.4 percent
black residents. Allegheny County’s population is slightly older than the national population.
While Allegheny County has only 18.6 percent of residents under the age of 18, the US
1
,population has 22.3 percent of residents under the age of 18. Likewise, Allegheny County has
more population over the age of 65 which includes 19.3 percent of residents, while the US
has only 16.5 percent. Allegheny County outperforms US high school graduation rates at
94.6 percent compared to the US 88 percent. Allegheny County boasts only 5 percent of
residents are uninsured in comparison to the US average of 9.5 percent. Allegheny County’s
population has a higher per capita income ($38,709) compared to the United States
($34,103); however, Allegheny County has a higher poverty level at 10.8 percent compared
to the US 10.5 percent indicating an issue of income inequality within the county (United
States Census Bureau, n.d.).
3. Sociodemographic Profile Table
Population Characteristics County United States
Population Estimates 1,216,045 328,745,538
Population Percent Change -0.6% 6.3%
Percent of Persons Under the Age of 18 18.6% 22.3%
Percent of Persons 65 Years and Over 19.3% 16.5%
Percent of Female Persons 51.6% 50.8%
Percent White alone 79.9% 76.3%
Percent Black or African American alone 13.4% 13.4%
Percent American Indian and Alaska Native alone 0.2% 1.3%
Percent Asian alone 4.2% 5.9%
Percent Native Hawaiian and Other Pacific N/A 0.2%
Islander alone
Percent Two or More Races 2.3% 2.8%
Percent Hispanic or Latino alone 2.3% 18.5%
Percent White alone, not Hispanic or Latino 78.1% 60.1%
Language Other Than English Spoken at Home, 7.5% 21.6%
Percent of persons 5 years +
Percent of Houses with a Computer 89.2% 90.3%
Percent with High School Graduate or Higher 94.6% 88.0%
Percent with a Disability, Under Age 65 Years 9.1% 8.6%
Percent without Health Insurance, Under Age 65 5.0% 9.5%
Years
Percent in Civilian Labor Force Age 16 Years+ 64.9% 63.0%
Percent of Females in Civilian Labor Force Age 60.2% 58.3%
2
, 16 Years+
12,756,157 2,040,441,2
Total Healthcare and Social Assistance Revenue
03
Total Retail Sales Per Capita $16,719 $13,443
Per Capita Income in the Past 12 Months $38,709 $34,103
Percent of Persons in Poverty 10.8% 10.5%
Population Per Square Mile 1,675.6 87.4
(United States Census Bureau, n.d.).
B. COUNTY HEALTH TRENDS & RANKINGS
1. Introductory Paragraph
In order to improve the health of a community, it is crucial to review the data of health facts
about the community. Once the data is gathered, it can be reviewed and analyzed to determine the
changes that are necessary to improve health. Only after data is gathered and analyzed can it be
used to develop an implementation plan for change.
Seven health trends for Allegheny County, Pennsylvania were collected using the County
Health Rankings and Roadmaps website that is supported by the Robert Wood Johnson Foundation.
The seven trends reviewed were: adult obesity, physical inactivity, uninsured, preventable hospital
stays, unemployment, violent crime, and air pollution-particulate matter. Adult obesity was chosen
due to its worsening trend. Physical inactivity and uninsured persons were chosen due to the county
being better than the national averages while continuing to improve. Preventable hospital stays and
unemployment were chosen due to the lack of changing trends. Violent crimes and air pollution
were chosen as they are at concerning levels although beginning to improve. The data in each
category was compared to the state data and national data (County Health Rankings & Roadmaps,
2021b).
2. Discussion of Health Trends
The Trend graphs reviewed from the County Health Rankings and Roadmaps website
allowed for easy visualization of comparing the health trends for county, state, and nation.
The visualized trends allow for easy determination of whether the county is improving,
3