Data Science Research Methods
JBM020
,Part 1: method that CAN with FIXED effects
19 april:
o Read: Sections 3.3.1. and 3.3.2. from experimental design
o Read: Chapter 2 from experimental design
3.3.1. p-Value
p-value: quantity of hypothesis testing . Represents the weight of
evidence against a null hypothesis.
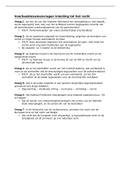
In a graph, the p-value is the area to the right of the X value. We can thus
interpret is as the highest significance level for which we still accept H 0. If
α is pre-set, H 0 is rejected if the p-value is less than α , otherwise it is
accepted.
One-sided upper-tailed test: p-value is the area to the right of the test
statistic.
One-sided lower-tailed test: p-value is the area to the left of the test
statistic.
Two-sided test: p-value is double the area to the right or left (the smallest)
of the test statistic.
3.3.2. Type I and Type II Errors
Type I Error: the error of rejecting an H 0 when it is true.
Type II Error: the error or accepting an H 0 when it is false.
The significance level α =P∨(reject H 0∨H 0 true) is the probability that we
reject H 0 when it is true. This Type I error can be made smaller by
decreasing the value of α . However, than the Type II error becomes more
probable. It is a trade-off. The probability of an Type II error is
β=P( accept H 0 ∨H 0 false). Its value depends on the real value of μ. Therefore
is it different for each value of μ. As the separation between the mean
under H 0 and the assumed true mean under H 1 increases, β decreases.
The probability of correctly accepting an H 0 is 1−α and the probability of
correctly rejecting an H 0 is 1−β .
The optimal solution depends on the consequences of each type of error.
This makes it situation-specific.
,Chapter 2: One-Factor Designs and the Analysis
of Variance
2.1. One-Factor Designs
It studies the impact of a single factor on some performance measure.
Notation:
Y is the dependent variable.
X is the independent variable.
ε is a random error component, representing all other factors than X that
have an influence.
To show there is a functional relationship: Y =f ( X , ε ) .
Y ij → i is the value of Y for this person and j is the value of X .
Replicated experiment: it has more than one data value at each level
of the factor under study.
The number of rows, different values of Y , is the number of replicates. The
total number of experimental outcomes is the number of rows times the
number of columns.
2.1.1. The Statistical Model
An example is Y ij =μ+ τ j +ε ij with μ the mean and τ j the differential effect
associated with the j th level of X and ε ij the noise of error.
Those last three values need to be estimated.
2.1.2. Estimation of the Parameters of the Model
R
A column means is denoted as Y ∙ j=∑ Y ij / R .
i=1
Grand mean: the average of all RC data points, Y ∙ ∙ . It is the sum of all
values divided by RC ór the sum of all column means divided by C . If the
number of data points is not equal for each row, it can also be computed
as a weighted average of the columns means.
As criterion for those mean estimates, there is least squares: the optimal
estimation is the estimate that minimizes the sum of the squared
differences between the actual values and the “predicted values”. This
estimate is often labelled as e . It used T j as an estimate for τ j (using Y ∙ j−Y ∙ ∙
) and M as an estimate for μ (using Y ∙ ∙).
2 2
e ij =( Y ij −M −T j ) ∧∑∑ ( e ij ) =∑ ∑ ( Y ij −M −T j )
The ∑ ∑ is a summation over all R and again over all C , order does not
matter.
, From derivation the estimates, we get e ij =Y ij −Y ∙∙ .
JBM020
,Part 1: method that CAN with FIXED effects
19 april:
o Read: Sections 3.3.1. and 3.3.2. from experimental design
o Read: Chapter 2 from experimental design
3.3.1. p-Value
p-value: quantity of hypothesis testing . Represents the weight of
evidence against a null hypothesis.
In a graph, the p-value is the area to the right of the X value. We can thus
interpret is as the highest significance level for which we still accept H 0. If
α is pre-set, H 0 is rejected if the p-value is less than α , otherwise it is
accepted.
One-sided upper-tailed test: p-value is the area to the right of the test
statistic.
One-sided lower-tailed test: p-value is the area to the left of the test
statistic.
Two-sided test: p-value is double the area to the right or left (the smallest)
of the test statistic.
3.3.2. Type I and Type II Errors
Type I Error: the error of rejecting an H 0 when it is true.
Type II Error: the error or accepting an H 0 when it is false.
The significance level α =P∨(reject H 0∨H 0 true) is the probability that we
reject H 0 when it is true. This Type I error can be made smaller by
decreasing the value of α . However, than the Type II error becomes more
probable. It is a trade-off. The probability of an Type II error is
β=P( accept H 0 ∨H 0 false). Its value depends on the real value of μ. Therefore
is it different for each value of μ. As the separation between the mean
under H 0 and the assumed true mean under H 1 increases, β decreases.
The probability of correctly accepting an H 0 is 1−α and the probability of
correctly rejecting an H 0 is 1−β .
The optimal solution depends on the consequences of each type of error.
This makes it situation-specific.
,Chapter 2: One-Factor Designs and the Analysis
of Variance
2.1. One-Factor Designs
It studies the impact of a single factor on some performance measure.
Notation:
Y is the dependent variable.
X is the independent variable.
ε is a random error component, representing all other factors than X that
have an influence.
To show there is a functional relationship: Y =f ( X , ε ) .
Y ij → i is the value of Y for this person and j is the value of X .
Replicated experiment: it has more than one data value at each level
of the factor under study.
The number of rows, different values of Y , is the number of replicates. The
total number of experimental outcomes is the number of rows times the
number of columns.
2.1.1. The Statistical Model
An example is Y ij =μ+ τ j +ε ij with μ the mean and τ j the differential effect
associated with the j th level of X and ε ij the noise of error.
Those last three values need to be estimated.
2.1.2. Estimation of the Parameters of the Model
R
A column means is denoted as Y ∙ j=∑ Y ij / R .
i=1
Grand mean: the average of all RC data points, Y ∙ ∙ . It is the sum of all
values divided by RC ór the sum of all column means divided by C . If the
number of data points is not equal for each row, it can also be computed
as a weighted average of the columns means.
As criterion for those mean estimates, there is least squares: the optimal
estimation is the estimate that minimizes the sum of the squared
differences between the actual values and the “predicted values”. This
estimate is often labelled as e . It used T j as an estimate for τ j (using Y ∙ j−Y ∙ ∙
) and M as an estimate for μ (using Y ∙ ∙).
2 2
e ij =( Y ij −M −T j ) ∧∑∑ ( e ij ) =∑ ∑ ( Y ij −M −T j )
The ∑ ∑ is a summation over all R and again over all C , order does not
matter.
, From derivation the estimates, we get e ij =Y ij −Y ∙∙ .