HC1: INTRODUCTION
Helpful Youtube channels:
Simple learning pro (nice graphics)
Dr Nic’s Maths and Stats
Andy Field
Dr. Todd Grande
Helpful non-audiovisual content:
Statistical tests: Laerd statistics (just google the test + Laerd statistics)
Statistical tests: IDRE UCLS: https://stats.idre.ucla.edu/other/dae/
Field’s webpage: discoveringstatistics.com (including videos)
Answers self-tests Field: http://milton-the-cat.rocks/home/dsus_test.html
Reporting results:
Wrong: “The higher you score on age, the higher you score on hours watching TV”
Right: “People who are older watch significantly more TV than people who are younger”
Right: “The older people are, the more time they spend watching TV”
The research process:
Generating theories and hypotheses:
Theories: An hypothesized general principle set of principles that explain known findings
about a topic from which new hypotheses can be generated (e.g. Newton’s new law of
universal gravitation).
Hypothesis: a prediction (scientific statement) from a theory
Testing hypotheses through falsification:
You can only examine whether a theory/hypothesis is credible, if there is a possibility to
disproof it.
The principle of hypothesis testing:
Point of departure / H0: assumption that there is no difference
- This gives a point of comparison
- If no difference then V1 – V2 = 0
- We can predetermine: If I measure e.g. IQ in 1000 persons, and the mean
difference between men and women is larger than 5 IQ-points, then it is very
unlikely that this difference is coincidence.
Types of hypotheses:
,Null hypothesis, H0:
This is the one we try to reject
There is no effect (most of the time)
E.g.: “Women are equally likely as men to wear a skirt or dress OR there is no
relationship between age and the number of wrinkles you have.
The alternative hypothesis, H1:
if we can reject H0, this one us supported by the data, but not proven!
E.g. Woman are more likely to wear a skirt or dress than men OR There is a positive
relationship between age and the number of wrinkles you have: the older people are,
the more wrinkles they have.
HC2:
, Make a histogram: graphs, chart builder, drag histogram to white box, run syntax. Shoesize is
for example not normally distributed, because you are including both genders (bimodal = 2
peaks). When you would separate the gender it would be more normally distributed.
When we measure a phenomenon in real life, there is usually variation in how the
phenomenon presents itself noticeable in the frequency distribution
Frequency distributions (aka histograms):
A graph plotting values of observations on the horizontal axis, with a bar showing how many
times each value occurred in the data set.
The normal distribution:
- bell shaped
- symmetrical around the centre
- the curve shows the idealized shape
we assume that a lot of characteristics are distributed normally in the entire population
Kurtosis: about the heaviness of the tails
more spiky (positive) = leptokurtic,
more bulky (negative) = platykurtic.
Still symmetrical
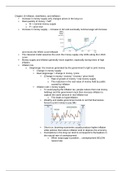
Skewness: about the symmetry of the distribution (not symmetrical anymore)3
Positive skew: scores bunched at low values with the tail pointing to high values; or tail-to-
right
Negative skew: scores bunched at high values with the tail pointing to low values; or tail-to-
left
Problem visualizing data in a histogram is informative, but can we find a more concise
representation of our data? And is there a way to predict someone’s score (more or less
accurately)
important features of a distribution:
The centre:
- mode: what happens most, good when you talk about categorical data
Issues with the mode: not necessarily informative, especially not in cases that
are not symmetrical
Bimodal: having to modes
Multimodal: having several modes
-median: the middle score when scores are ordered
Not so sensitive to outliers
But not always representative
- mean: the sum of scores divided by the number of scores.
The mean is a model of what happens in the real world: the typical
score. It’s not a perfect representation of the data.
Problem: really sensitive to outliers
How can we assess how well the mean represents reality?
The dispersion: (variation in data)
- range: the smallest score subtracted from the largest
But, very biased by outliers, and not so representative
Helpful Youtube channels:
Simple learning pro (nice graphics)
Dr Nic’s Maths and Stats
Andy Field
Dr. Todd Grande
Helpful non-audiovisual content:
Statistical tests: Laerd statistics (just google the test + Laerd statistics)
Statistical tests: IDRE UCLS: https://stats.idre.ucla.edu/other/dae/
Field’s webpage: discoveringstatistics.com (including videos)
Answers self-tests Field: http://milton-the-cat.rocks/home/dsus_test.html
Reporting results:
Wrong: “The higher you score on age, the higher you score on hours watching TV”
Right: “People who are older watch significantly more TV than people who are younger”
Right: “The older people are, the more time they spend watching TV”
The research process:
Generating theories and hypotheses:
Theories: An hypothesized general principle set of principles that explain known findings
about a topic from which new hypotheses can be generated (e.g. Newton’s new law of
universal gravitation).
Hypothesis: a prediction (scientific statement) from a theory
Testing hypotheses through falsification:
You can only examine whether a theory/hypothesis is credible, if there is a possibility to
disproof it.
The principle of hypothesis testing:
Point of departure / H0: assumption that there is no difference
- This gives a point of comparison
- If no difference then V1 – V2 = 0
- We can predetermine: If I measure e.g. IQ in 1000 persons, and the mean
difference between men and women is larger than 5 IQ-points, then it is very
unlikely that this difference is coincidence.
Types of hypotheses:
,Null hypothesis, H0:
This is the one we try to reject
There is no effect (most of the time)
E.g.: “Women are equally likely as men to wear a skirt or dress OR there is no
relationship between age and the number of wrinkles you have.
The alternative hypothesis, H1:
if we can reject H0, this one us supported by the data, but not proven!
E.g. Woman are more likely to wear a skirt or dress than men OR There is a positive
relationship between age and the number of wrinkles you have: the older people are,
the more wrinkles they have.
HC2:
, Make a histogram: graphs, chart builder, drag histogram to white box, run syntax. Shoesize is
for example not normally distributed, because you are including both genders (bimodal = 2
peaks). When you would separate the gender it would be more normally distributed.
When we measure a phenomenon in real life, there is usually variation in how the
phenomenon presents itself noticeable in the frequency distribution
Frequency distributions (aka histograms):
A graph plotting values of observations on the horizontal axis, with a bar showing how many
times each value occurred in the data set.
The normal distribution:
- bell shaped
- symmetrical around the centre
- the curve shows the idealized shape
we assume that a lot of characteristics are distributed normally in the entire population
Kurtosis: about the heaviness of the tails
more spiky (positive) = leptokurtic,
more bulky (negative) = platykurtic.
Still symmetrical
Skewness: about the symmetry of the distribution (not symmetrical anymore)3
Positive skew: scores bunched at low values with the tail pointing to high values; or tail-to-
right
Negative skew: scores bunched at high values with the tail pointing to low values; or tail-to-
left
Problem visualizing data in a histogram is informative, but can we find a more concise
representation of our data? And is there a way to predict someone’s score (more or less
accurately)
important features of a distribution:
The centre:
- mode: what happens most, good when you talk about categorical data
Issues with the mode: not necessarily informative, especially not in cases that
are not symmetrical
Bimodal: having to modes
Multimodal: having several modes
-median: the middle score when scores are ordered
Not so sensitive to outliers
But not always representative
- mean: the sum of scores divided by the number of scores.
The mean is a model of what happens in the real world: the typical
score. It’s not a perfect representation of the data.
Problem: really sensitive to outliers
How can we assess how well the mean represents reality?
The dispersion: (variation in data)
- range: the smallest score subtracted from the largest
But, very biased by outliers, and not so representative