Lecture notes Multi Level Analysis
Course: Topics in Causal Analysis 2021/2022
Study: Bachelor Psychology (or Data Science) Tilburg University
Topics in causal analysis
This course exists out of two topics:
1. Mediation, moderation and conditional process analysis. (Lecturer: Guy Moors)
2. Multilevel Analysis. (Lecturer: John Gelissen)
This summary covers topic 2.
Multi-level Analysis
Introduction
First you’re going to look at some examples of research questions:
- To what extent does organizational climate predict an employee’s performance
outcomes over and above the employee’s individual background characteristics?
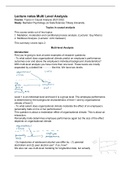
With multi-level analysis you have more than one level. These levels are mostly
separated by a dotted line - - - - - - like this. We have two levels:
Level 1 is an individual level and level 2 is a group level. The employee performance
is determined by the background characteristics of level 1 and by organisational
climate of level 2.
- To what extent does organizational climate moderate the effect of an employee’s
personality traits on his or her performance?
This question is about a moderation effect of organisational climate. This is about an
interaction:
Personality traits determines employee performance again but the size of the effect
depends on organisational climate.
- Do trajectories of adolescent alcohol use differ by: (1) parental
alcoholism and (2) peer alcohol use? if so, how?
We also can use multi-level modeling for longitudinal data, but actually
,we’re using repeated measures. Alcohol use is the dependent variable and we
measured it in three moments in time of two adolescents:
The question is why the slopes can be different per adolescent. Then we use
covariates as explanatory variables.
- To what extent are attitudes towards environmental protection of individuals
determined by the wealth of the country in which they live, their country’s
environmental circumstances and their country’s postmaterialist cultural orientation,
taking into account their individual background characteristics.
In this case we have as a dependent variable support for environmental protection
(individual level) that is determined by gender, age, level of education et cetera. We
also have a country level:
These research questions have in common that they make use of the hierarchical
nature of data:
Multi-level is often used in organisational or human resources studies because they
usually have data from clustered data collections. This means that the people that
are in the data mostly aren’t from a random sample but from some kind of multi-stage
sampling. If we want to make a model of employee performance in the Netherlands,
,it’s impossible to collect data from every single employee. So instead you’d start with
a list of all the organisations of the country and take a random sample out of that list.
Then you could make a sample frame of the departments and then a sample frame
of all the teams in these departments. Once you have these teams you can draw a
sample frame of all the individual employees in these teams. So you have multiple
levels of analysis that are described with different characteristics.
When we have a design with clustered sampling of units with different levels, we are
actually violating an important assumption of Ordinary Least Squares (OLS)
regression analysis. Namely the assumption of the independence of observations.
Because with this type of clustering we get a kind of dependency between these
observations. This is important for the conclusions of multi-level data. If you’re only
analysing group level variables there is no issue with dependency. If you only have
individual level variables it’s still possible to have some kind of dependency, for
instance if participants have the same postal code they have more in common then
with people that live in another postal code.
The top left model can be analysed with multi-level but the top right cannot. The top
right will therefore not be discussed in this course. The bottom model is a
combination of two, also known as the Coleman boat. With multi-level we can only
analyse part of the model as shown on the right.
Substantive and statistical reasons to use multi-level analysis:
- Separate effects due to varying composition of groups in terms of individual
characteristics (due to clustering of individuals within groups) from true contextual
effects: composition effects vs. contextual effects. It means that individual
characteristics can explain some group level differences if the proportion of these
individual characteristics is not exactly the same in all the groups. So if you have
multiple groups and every group has a different percentage of females. Then gender
can explain some of the between-group variance in the outcome: composition effect.
When a group level characteristic has an effect on an individual level outcome, it’s a
contextual effect.
- OLS regression does not tell us how much variation there is at each level of
analysis and with multi-level we get information about the variation at each level of
analysis.
- Variables refer to the theoretically correct level of analysis so the chance of the
mistake of ecological fallacy (making group assumptions based on individual level
and vice versa) is smaller.
- Disaggregation of macro-characteristics to individual characteristics (i.e., giving
, every individual the same group score) inflates type 1 errors of macro effects
(standard errors will be biased). If you ignore important dependency in your data the
standard error could be smaller than it actually is, making results significant when
they shouldn’t be. Multi-level analysis takes the dependencies into account.
The logic of multi-level analysis
Multi-level analysis is also known as hierarchical linear modeling (HLM). It’s called
hierarchical because we assume there is some kind of nested structure in our data.
That we have lower level units that are imbedded in higher order units. HLM is also
the name of a software package of multi-level analysis, it’s one of the first packages
for multi-level analysis. People talk about multi-level analysis as a description for a
broader class of models, and use more names like random coefficient models and
mixed models. Al these descriptions have in common that these models combine
fixed and random effects. Overall we can say that these models are all for
hierarchically nested data structures (clustered data). The outcome/the dependent
variable of which we want to explain the variation is defined at the lowest level. The
independent variables/the explanatory levels are at the lowest and higher levels.
Example
We have data for 50 departments, with each 20 employees, but for the moment we
neglect that the individuals come from different departments. There are two individual
variables: helping behaviour (dependent variable) and individual mood (independent
variable). To analyse this data set in with regression in SPSS, you go to analyse
regression linear to get the following output:
R square is .643 so mood explains 64.3% of the variance in helping. This is
Course: Topics in Causal Analysis 2021/2022
Study: Bachelor Psychology (or Data Science) Tilburg University
Topics in causal analysis
This course exists out of two topics:
1. Mediation, moderation and conditional process analysis. (Lecturer: Guy Moors)
2. Multilevel Analysis. (Lecturer: John Gelissen)
This summary covers topic 2.
Multi-level Analysis
Introduction
First you’re going to look at some examples of research questions:
- To what extent does organizational climate predict an employee’s performance
outcomes over and above the employee’s individual background characteristics?
With multi-level analysis you have more than one level. These levels are mostly
separated by a dotted line - - - - - - like this. We have two levels:
Level 1 is an individual level and level 2 is a group level. The employee performance
is determined by the background characteristics of level 1 and by organisational
climate of level 2.
- To what extent does organizational climate moderate the effect of an employee’s
personality traits on his or her performance?
This question is about a moderation effect of organisational climate. This is about an
interaction:
Personality traits determines employee performance again but the size of the effect
depends on organisational climate.
- Do trajectories of adolescent alcohol use differ by: (1) parental
alcoholism and (2) peer alcohol use? if so, how?
We also can use multi-level modeling for longitudinal data, but actually
,we’re using repeated measures. Alcohol use is the dependent variable and we
measured it in three moments in time of two adolescents:
The question is why the slopes can be different per adolescent. Then we use
covariates as explanatory variables.
- To what extent are attitudes towards environmental protection of individuals
determined by the wealth of the country in which they live, their country’s
environmental circumstances and their country’s postmaterialist cultural orientation,
taking into account their individual background characteristics.
In this case we have as a dependent variable support for environmental protection
(individual level) that is determined by gender, age, level of education et cetera. We
also have a country level:
These research questions have in common that they make use of the hierarchical
nature of data:
Multi-level is often used in organisational or human resources studies because they
usually have data from clustered data collections. This means that the people that
are in the data mostly aren’t from a random sample but from some kind of multi-stage
sampling. If we want to make a model of employee performance in the Netherlands,
,it’s impossible to collect data from every single employee. So instead you’d start with
a list of all the organisations of the country and take a random sample out of that list.
Then you could make a sample frame of the departments and then a sample frame
of all the teams in these departments. Once you have these teams you can draw a
sample frame of all the individual employees in these teams. So you have multiple
levels of analysis that are described with different characteristics.
When we have a design with clustered sampling of units with different levels, we are
actually violating an important assumption of Ordinary Least Squares (OLS)
regression analysis. Namely the assumption of the independence of observations.
Because with this type of clustering we get a kind of dependency between these
observations. This is important for the conclusions of multi-level data. If you’re only
analysing group level variables there is no issue with dependency. If you only have
individual level variables it’s still possible to have some kind of dependency, for
instance if participants have the same postal code they have more in common then
with people that live in another postal code.
The top left model can be analysed with multi-level but the top right cannot. The top
right will therefore not be discussed in this course. The bottom model is a
combination of two, also known as the Coleman boat. With multi-level we can only
analyse part of the model as shown on the right.
Substantive and statistical reasons to use multi-level analysis:
- Separate effects due to varying composition of groups in terms of individual
characteristics (due to clustering of individuals within groups) from true contextual
effects: composition effects vs. contextual effects. It means that individual
characteristics can explain some group level differences if the proportion of these
individual characteristics is not exactly the same in all the groups. So if you have
multiple groups and every group has a different percentage of females. Then gender
can explain some of the between-group variance in the outcome: composition effect.
When a group level characteristic has an effect on an individual level outcome, it’s a
contextual effect.
- OLS regression does not tell us how much variation there is at each level of
analysis and with multi-level we get information about the variation at each level of
analysis.
- Variables refer to the theoretically correct level of analysis so the chance of the
mistake of ecological fallacy (making group assumptions based on individual level
and vice versa) is smaller.
- Disaggregation of macro-characteristics to individual characteristics (i.e., giving
, every individual the same group score) inflates type 1 errors of macro effects
(standard errors will be biased). If you ignore important dependency in your data the
standard error could be smaller than it actually is, making results significant when
they shouldn’t be. Multi-level analysis takes the dependencies into account.
The logic of multi-level analysis
Multi-level analysis is also known as hierarchical linear modeling (HLM). It’s called
hierarchical because we assume there is some kind of nested structure in our data.
That we have lower level units that are imbedded in higher order units. HLM is also
the name of a software package of multi-level analysis, it’s one of the first packages
for multi-level analysis. People talk about multi-level analysis as a description for a
broader class of models, and use more names like random coefficient models and
mixed models. Al these descriptions have in common that these models combine
fixed and random effects. Overall we can say that these models are all for
hierarchically nested data structures (clustered data). The outcome/the dependent
variable of which we want to explain the variation is defined at the lowest level. The
independent variables/the explanatory levels are at the lowest and higher levels.
Example
We have data for 50 departments, with each 20 employees, but for the moment we
neglect that the individuals come from different departments. There are two individual
variables: helping behaviour (dependent variable) and individual mood (independent
variable). To analyse this data set in with regression in SPSS, you go to analyse
regression linear to get the following output:
R square is .643 so mood explains 64.3% of the variance in helping. This is