Unit 5 - assignment 2
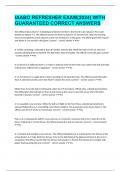
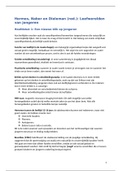
The first sheet of the data model shows vaccination data about different countries which
includes data about :
● Population
● Amount of people vaccinated
● Amount of people not vaccinated
● Total vaccinations
● Total people that are not vaccinated
● Average number of people vaccinated
● Average number of people not vaccinated.
● Average population
For calculating the total number of vaccinated people and not vaccinated I used the sum
function. For calculating the average number of people vaccinated and not vaccinated I used
the average function. I also have used the if function to display a message about how well
the vaccination program goes. So if there are less people vaccinated that the people that
have not been vaccinated there will be displayed a “bad” message but if the number of
people vaccinated surpasses the number of people that have not been vaccinated there will
be displayed a “good” message.
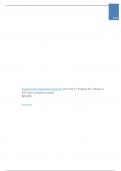
I also have included a chart where you can easily understand the data that I entered.
I have used the min and max function to display the minimum and maximum number of
people vaccinated and not vaccinated.
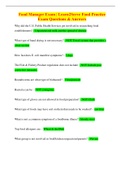
For the 2nd sheet I’ve done a Monthly vaccination in England.
I created :
● Months
, ● Amount of people vaccinated
● Amount of people not vaccinated
● Average number of people vaccinated
● Average number of people not vaccinated
● Total number of people vaccinated in a month
● Total number of people not vaccinated in a month
Like in the first sheet I used sum functions to calculate the total number of people, the
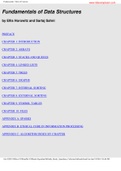
average function for calculating the average number of people and I included a chart where
you can observe how well the vaccination has been going in that month.
The first sheet of the data model shows vaccination data about different countries which
includes data about :
● Population
● Amount of people vaccinated
● Amount of people not vaccinated
● Total vaccinations
● Total people that are not vaccinated
● Average number of people vaccinated
● Average number of people not vaccinated.
● Average population
For calculating the total number of vaccinated people and not vaccinated I used the sum
function. For calculating the average number of people vaccinated and not vaccinated I used
the average function. I also have used the if function to display a message about how well
the vaccination program goes. So if there are less people vaccinated that the people that
have not been vaccinated there will be displayed a “bad” message but if the number of
people vaccinated surpasses the number of people that have not been vaccinated there will
be displayed a “good” message.
I also have included a chart where you can easily understand the data that I entered.
I have used the min and max function to display the minimum and maximum number of
people vaccinated and not vaccinated.
For the 2nd sheet I’ve done a Monthly vaccination in England.
I created :
● Months
, ● Amount of people vaccinated
● Amount of people not vaccinated
● Average number of people vaccinated
● Average number of people not vaccinated
● Total number of people vaccinated in a month
● Total number of people not vaccinated in a month
Like in the first sheet I used sum functions to calculate the total number of people, the
average function for calculating the average number of people and I included a chart where
you can observe how well the vaccination has been going in that month.