|SOLVED| WK 3 Assignment Understanding Measures of Central Tendancy - MATH-225: Statistical Reasoning for the Health Sciences-Questions and Answers
|SOLVED| WK 3 Assignment Understanding Measures of Central Tendancy - MATH-225: Statistical Reasoning for the Health Sciences-Questions and Answers Given the following box-and-whisker plot, decide if the data is skewed or symmetricaWhich of the following frequency tables show a skewed data set? Select all answers that applyWhich of the following frequency tables show a skewed data set? Select all answers that apply.For the following dataset, you are interested to determine the "spread" of the data. Would you employ calculations for the sample standard deviation, or population standard deviation for this dataset: Ages of all students in a Statistics course with an enrollment of 30 students.Which of the following lists of data has the smallest standard deviationA company is interested to know the variation in yearly sales amount for all 5 salespeople in the company.The dataset shown below is the sales amount sold by the 5 salespeople in the company (expressed in thousands of dollars):The data below are the monthly average high temperatures for November, December, January, and February in New York City from the Country Studies/Area Handbook Series sponsored by the U.S. Department of the Army between 1986 and 1998. What is the sample standard deviation?The following data values represent the daily amount spent by a family during a 7 day summer vacation.Which of the following lists of data has the smallest standard deviation?
Escuela, estudio y materia
- Institución
- Chamberlain College Of Nursing
- Grado
- MATH-225: Statistical Reasoning for the Health Sciences
Información del documento
- Subido en
- 8 de septiembre de 2021
- Número de páginas
- 29
- Escrito en
- 2021/2022
- Tipo
- Examen
- Contiene
- Preguntas y respuestas
Temas
-
which of the followin
-
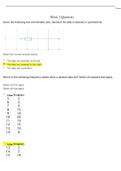
given the following box and whisker plot
-
decide if the data is skewed or symmetrica
-
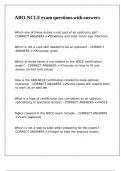
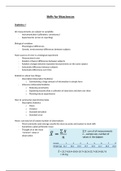
which of the following frequency tables show a skewed data set select all answers that apply
Documento también disponible en un lote