Introduction to statistics lecture note
Pink highlight---- we do not have to cover. Next year
Yellow highlight--- the section that I can’t understand haha
Lecture 0
Types of variables
1. Nominal
a. No rank order
b. No logical order (there is no reason that christianity is 1)
c. Closed (categorical questions)
i. Religion, political parties voted for
2. Ordinal
a. Rank order
b. Unequal distances (there is no meaning in the distances)
c. Closed question. You have to have the choices instead of box.
i. Disagree completely
ii. Likert scale.
3. Interval
a. Rank order
b. Equal and meaningful distances (every one unit is the same)
i. Celsiun, hourly wage
4. Ratio
a. Rank order
b. You cannot go below 0.
i. age , weight height
ii. But right now we do not care about the difference between ratio and
interval
5. Dichotomous variable
a. Two categories question
i. Only numbered as a 0 or 1.
WHy do we care about these variables?
- Different types of variables require different types of descriptions
- We want to describe the data.
- We cannot do that by showing all answers to a survey.
- 200 filled in surveys from de pijp project is a bit confusing.
- So we use different statistics to describe the data.
- A core function of statistics
- Centrality and dispersion
,Centrality
- Where is the center of the variable
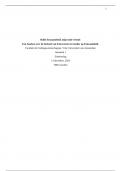
- Mode
- What is the most common value?
- Pie chart describes the mode. The biggest pie in the circle. ..but it is the
horrible way to interpret. Instead, Bar chart is better to describe the mode.
- Median
- What is the middle value?
- After rearranging the data from low to high, and the middle number is the
median.
- Mean
- What is the average value?
- By adding all things up and divided by the number of observations
Mean for dichotomous variables
- Mean equals the proportion
- Proportion of the variable 1
Centrality
- The type of variable defines the centrality measure that we can use.
- Nominal only can calculate mode.
- Ordinal can calculate mode and median
- And some people still calculate mean although it is not allowed
statistically
- Interval and ratio can calculate mode, median, mean.
- Dichotomous can calculate mode, but mainly mean.
- Centrality defined the center of the observations in data
- The center can be the most common value (mode).
- Or it can be the middle value (median)
- Often it’s the average value of a series of observations (mean).
- But there is more than centrality.
- That is … dispersion
- We can know more than centrality to describe the data.
- Only centrality tells little about the distribution of data.
- Data has certain level of dispersion.
Dispersion
- Different measures for dispersion.. How dispersed the variables are?
- Frequencies,
- How often do we see each answer
- Range
- What is the minimum and maximum value
- SD (s)
, - ...especially for interval Concerns the dispersion variable
- Variance (s2 )
Standard deviation
What is standard deviation?
- The sum of all squared distance to the mean
- For all observations
- If all observations are clustered around the mean, sum of distances will be small.
- If observations are widely around the mean, the sum of distances will be larger.
SD is the summary measure of the average distance to the mean
If there is more dispersion, the sd will be higher.
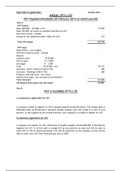
Example: statistics exam
- The mean grade for intro to stat was a 5.5.
- What do we know?
- Centrality
- What is unknown..
- Dispersion
- So we cannot know how the variables are dispersed around the mean. Both
histograms have the same means, but dispersion is different. Sd is higher for the
left graph.
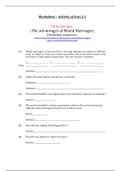
Why do we care about this? One application
Comparing distributions
- Imagine we want to compare different positions in distributions.
Pink highlight---- we do not have to cover. Next year
Yellow highlight--- the section that I can’t understand haha
Lecture 0
Types of variables
1. Nominal
a. No rank order
b. No logical order (there is no reason that christianity is 1)
c. Closed (categorical questions)
i. Religion, political parties voted for
2. Ordinal
a. Rank order
b. Unequal distances (there is no meaning in the distances)
c. Closed question. You have to have the choices instead of box.
i. Disagree completely
ii. Likert scale.
3. Interval
a. Rank order
b. Equal and meaningful distances (every one unit is the same)
i. Celsiun, hourly wage
4. Ratio
a. Rank order
b. You cannot go below 0.
i. age , weight height
ii. But right now we do not care about the difference between ratio and
interval
5. Dichotomous variable
a. Two categories question
i. Only numbered as a 0 or 1.
WHy do we care about these variables?
- Different types of variables require different types of descriptions
- We want to describe the data.
- We cannot do that by showing all answers to a survey.
- 200 filled in surveys from de pijp project is a bit confusing.
- So we use different statistics to describe the data.
- A core function of statistics
- Centrality and dispersion
,Centrality
- Where is the center of the variable
- Mode
- What is the most common value?
- Pie chart describes the mode. The biggest pie in the circle. ..but it is the
horrible way to interpret. Instead, Bar chart is better to describe the mode.
- Median
- What is the middle value?
- After rearranging the data from low to high, and the middle number is the
median.
- Mean
- What is the average value?
- By adding all things up and divided by the number of observations
Mean for dichotomous variables
- Mean equals the proportion
- Proportion of the variable 1
Centrality
- The type of variable defines the centrality measure that we can use.
- Nominal only can calculate mode.
- Ordinal can calculate mode and median
- And some people still calculate mean although it is not allowed
statistically
- Interval and ratio can calculate mode, median, mean.
- Dichotomous can calculate mode, but mainly mean.
- Centrality defined the center of the observations in data
- The center can be the most common value (mode).
- Or it can be the middle value (median)
- Often it’s the average value of a series of observations (mean).
- But there is more than centrality.
- That is … dispersion
- We can know more than centrality to describe the data.
- Only centrality tells little about the distribution of data.
- Data has certain level of dispersion.
Dispersion
- Different measures for dispersion.. How dispersed the variables are?
- Frequencies,
- How often do we see each answer
- Range
- What is the minimum and maximum value
- SD (s)
, - ...especially for interval Concerns the dispersion variable
- Variance (s2 )
Standard deviation
What is standard deviation?
- The sum of all squared distance to the mean
- For all observations
- If all observations are clustered around the mean, sum of distances will be small.
- If observations are widely around the mean, the sum of distances will be larger.
SD is the summary measure of the average distance to the mean
If there is more dispersion, the sd will be higher.
Example: statistics exam
- The mean grade for intro to stat was a 5.5.
- What do we know?
- Centrality
- What is unknown..
- Dispersion
- So we cannot know how the variables are dispersed around the mean. Both
histograms have the same means, but dispersion is different. Sd is higher for the
left graph.
Why do we care about this? One application
Comparing distributions
- Imagine we want to compare different positions in distributions.