IS434 Assignment 2
Part A (Scientific Network)
Questions
1. Which pair(s) of authors collaborated the most? Show top 3 pairs. Explain how you chose
these 3 pairs? What criterion/criteria did you use?
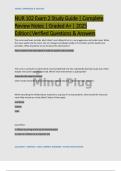
A simple sort of the given dataset Newman-Cond_mat_95-99-co_occurrence.txt by the
highest number of papers co-published in descending order reveals that the following top 3
pairs of authors collaborated the most (for more details, see dataframe for Newman-
Cond_mat_95-99-co_occurrence.ipynb):
Author 1 Author 2 Number of papers co-published
PFEIFFER, LN WEST, KW 37
RIKVOLD, PA NOVOTNY, MA 32
BELITZ, D KIRKPATRICK, TR 29
2. Identify one or more influencers in this network and explain how and why these are
influencers. In answering this question, you must calculate at least three centrality metrics
(you can use the ones we learned in class OR research other methods online) AND explain
what the calculated numbers mean contextually.
In social network analysis, centrality measures are used to identify nodes with strategic
significance in the network. Such nodes can be considered influencers, due to their position
of influence and control over the flow of information in a given network.
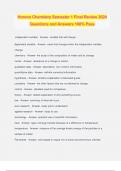
Calculating the top ten highest scores in terms of betweenness, closeness, degree and
eigenvector centralities in the network, the name UCHIDA, S consistently surfaces across
these four centrality measures as having one of the ten highest centrality scores. As such,
we think he is an influencer in the network. Two other authors who could be considered
influencers based on their high degree and eigenvector centrality scores are UEDA, Y and
EISAKI, H.
Further investigation confirms that UCHIDA, S is very influential, having the highest degree
centrality and eigenvector centrality score among the nodes in the network.
Degree centrality is a measure of the power or popularity of a node in a network. It is
defined as the number of links a particular node has with other nodes in the network. In the
case of the scientific network, the degree is the number of authors a particular author
, collaborated with. Based on his high degree centrality score, UCHIDA, S appears to have the
most collaboration with other scientists in the network.
Eigenvector Centrality, also called prestige score, is a measure of a node’s influence in a
network. It takes into account the network topology, giving a higher score to nodes who are
connected to other nodes who themselves have high centrality scores. Apparently, not only
did UCHIDA, S collaborate the most with other authors, he collaborated with those authors
who also had high centrality scores.
Other noteworthy authors are MACDONALD, AH and SARMA, SD. Though these two authors
did not rank high on degree centrality, they rank within the top 3 in both closeness and
betweenness centrality, suggesting that they link clusters in the network and are well
connected to other well-connected people.
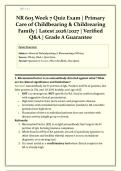
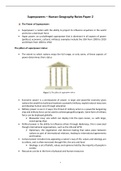
Betweenness Centrality is calculated by the number of shortest paths that pass through
a node. Someone who acts as an intermediary (high betweenness) connecting multiple
otherwise disconnected clusters in a network has much power and influence, as he has high
control over the flow of knowledge and information in the network.
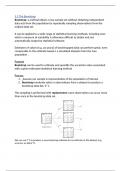
Closeness Centrality is defined as the average geodesic distance or the average shortest
path length, between a vertex and all the other vertices that are reachable from it. A node
with high closeness centrality is often directly connected to most other nodes in the
network. It has low dependence on intermediate nodes for information and can quickly
spread information to other nodes in the network. (for more detail, please refer to
Scientific Network (Assignment2 Part A).ipynb)
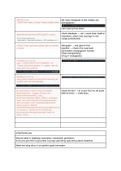
Figure 1: Top 10 authors ordered by betweenness and closeness centrality in descending order.
Part A (Scientific Network)
Questions
1. Which pair(s) of authors collaborated the most? Show top 3 pairs. Explain how you chose
these 3 pairs? What criterion/criteria did you use?
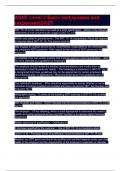
A simple sort of the given dataset Newman-Cond_mat_95-99-co_occurrence.txt by the
highest number of papers co-published in descending order reveals that the following top 3
pairs of authors collaborated the most (for more details, see dataframe for Newman-
Cond_mat_95-99-co_occurrence.ipynb):
Author 1 Author 2 Number of papers co-published
PFEIFFER, LN WEST, KW 37
RIKVOLD, PA NOVOTNY, MA 32
BELITZ, D KIRKPATRICK, TR 29
2. Identify one or more influencers in this network and explain how and why these are
influencers. In answering this question, you must calculate at least three centrality metrics
(you can use the ones we learned in class OR research other methods online) AND explain
what the calculated numbers mean contextually.
In social network analysis, centrality measures are used to identify nodes with strategic
significance in the network. Such nodes can be considered influencers, due to their position
of influence and control over the flow of information in a given network.
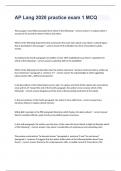
Calculating the top ten highest scores in terms of betweenness, closeness, degree and
eigenvector centralities in the network, the name UCHIDA, S consistently surfaces across
these four centrality measures as having one of the ten highest centrality scores. As such,
we think he is an influencer in the network. Two other authors who could be considered
influencers based on their high degree and eigenvector centrality scores are UEDA, Y and
EISAKI, H.
Further investigation confirms that UCHIDA, S is very influential, having the highest degree
centrality and eigenvector centrality score among the nodes in the network.
Degree centrality is a measure of the power or popularity of a node in a network. It is
defined as the number of links a particular node has with other nodes in the network. In the
case of the scientific network, the degree is the number of authors a particular author
, collaborated with. Based on his high degree centrality score, UCHIDA, S appears to have the
most collaboration with other scientists in the network.
Eigenvector Centrality, also called prestige score, is a measure of a node’s influence in a
network. It takes into account the network topology, giving a higher score to nodes who are
connected to other nodes who themselves have high centrality scores. Apparently, not only
did UCHIDA, S collaborate the most with other authors, he collaborated with those authors
who also had high centrality scores.
Other noteworthy authors are MACDONALD, AH and SARMA, SD. Though these two authors
did not rank high on degree centrality, they rank within the top 3 in both closeness and
betweenness centrality, suggesting that they link clusters in the network and are well
connected to other well-connected people.
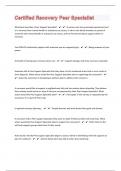
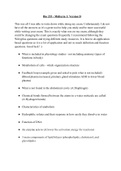
Betweenness Centrality is calculated by the number of shortest paths that pass through
a node. Someone who acts as an intermediary (high betweenness) connecting multiple
otherwise disconnected clusters in a network has much power and influence, as he has high
control over the flow of knowledge and information in the network.
Closeness Centrality is defined as the average geodesic distance or the average shortest
path length, between a vertex and all the other vertices that are reachable from it. A node
with high closeness centrality is often directly connected to most other nodes in the
network. It has low dependence on intermediate nodes for information and can quickly
spread information to other nodes in the network. (for more detail, please refer to
Scientific Network (Assignment2 Part A).ipynb)
Figure 1: Top 10 authors ordered by betweenness and closeness centrality in descending order.