MDVA Lectures
Lecture 1: Multiple Regression Analysis (MRA)
Research Questions
Examples:
- Can depression in dutch adults be predicted from life events and coping?
- Do teaching methods have an effect on arithmetic performance of middle class
children?
Above research questions have two components:
● Specific relationship between constructs (what we want to investigate)
● A population of interest (sample ---> testing ---> generalise)
To test a research question (for a population):
● Take a sample from the population of interest
● Measure the relevant constructs
- Data are called variables (e.g. depression, life events, coping)
● Apply appropriate statistical technique to answer question
- This course on MVDA
Univariate ---> relationship between 2 variables (e.g. age and income)
Multivariate ---> relationship between 3 or more variables
- Dynamics between 3 variables are more complex than between 2
Techniques Weeks 1 to 4
Data in weeks 1 to 4
● 1 dependent variable Y
● Several independent variables X1, X2, … (predictors)
Research question
● Can Y be predicted from X1 and/or X2?
Which technique depends on measurement level of variables
3 levels of measurement are relevant (in this course):
● NOM: Nominal level - only distinguishes categories
- E.g. no therapy, psycho-dynamic, exposure
● INT: Interval level - if intervals meaningful / order
- E.g. weights, height, IQ score, BDI score (quasi-interval)
, ● BIN: Binary variables - has 2 categories (can be NOM or INT)
- E.g. pass / fail, male / female
X1, X2 Y Technique Abbreviation
INT INT Multiple regression Analysis MRA
NOM INT Analysis of variance ANOVA
NOM + INT INT Analysis of covariance ANCOVA
INT BIN Logistic regression analysis LRA
Remarks
● X1, X2 can also be BIN
● If Y is BIN, then we have to use LRA
Introduction
Multiple Regression Analysis (MRA)
Measurement levels:
● Dependent variable Y is INT
● Independent variables X1, X2 are INT
1) Illustrative (fictional) example
Health psychologist:
Can depression (Y) be predicted from life events (X1 and/or coping (X2)?
Psychologist conducts a study with 60 dutch adults
, - Asks participant about number of life events
- Uses test to measure coping index of participant
- Uses Beck Depression Inventory (BDI) to measure depression
All variables are INT
- Number of life events (0,1,2,3,...): e.g. financial difficulties, relationship troubles,
disease, etc.
- Coping index (1 = no coping, 10 = good coping)
- BDI score (0-9 minimal, 10-18 mild, 19-29 moderate, 30-63 severe depression)
2) Regression model
Can Y be predicted from X1 and/or X2? (Y, X1, X2 = INT)
Model that works really well:
Dependent variable Y is a linear function of predictors X1 and X2 (can be described by a
straight line)
Regression model
● Simple regression: Yi = b*0 + b*1 X1i + ei
● Multiple regression: Yi = b*0 + b*1 X1i + b*2 X2i + … + b*k Xki + ei
Where
● b*0 is the (population) regression constant
● b*1, b*2 and b*k are (population) regression coefficients
● X1i, X2i, Xki and Yi are the scores on X1, X2, Xk and Y of individual i
● ei is a residual (= error)
The parameters b*0, b*1, b*2 and b*k need to be estimated from the data (sample)
Linear Model: least squares estimation (e.g. SPSS)
Fit a Line
Linear model with one predictor
Simple regression - fit a straight line through a set of data points
- Each participant is a point
- Slope (the way it points upwards or downwards) is the regression coefficient
- If 0 the line would be flat, if positive (+) the line would slope up, if negative (-) the line
would slope down
, Regression Equation
Let Ŷi denote the prediction of Yi
Relationship: Ŷi = Ŷi + ei (actual data = regression model (what we think it should be) + error)
Regression equation:
● Simple regression: Ŷi = b0 + b1 X1i
● Multiple regression: Ŷi = b0 + b1 X1i + b2 X2i + … bk Xki
Where
● b0, b1, b2 and bk are estimate of b*0, b*1, b*2 and b*k
Best prediction (least squares) if the sum of squared differences is minimal
(Actual score of participant - predicted score of participant)²
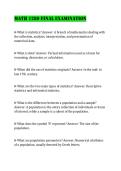
Regression Line
With one predictor - regression line
Lecture 1: Multiple Regression Analysis (MRA)
Research Questions
Examples:
- Can depression in dutch adults be predicted from life events and coping?
- Do teaching methods have an effect on arithmetic performance of middle class
children?
Above research questions have two components:
● Specific relationship between constructs (what we want to investigate)
● A population of interest (sample ---> testing ---> generalise)
To test a research question (for a population):
● Take a sample from the population of interest
● Measure the relevant constructs
- Data are called variables (e.g. depression, life events, coping)
● Apply appropriate statistical technique to answer question
- This course on MVDA
Univariate ---> relationship between 2 variables (e.g. age and income)
Multivariate ---> relationship between 3 or more variables
- Dynamics between 3 variables are more complex than between 2
Techniques Weeks 1 to 4
Data in weeks 1 to 4
● 1 dependent variable Y
● Several independent variables X1, X2, … (predictors)
Research question
● Can Y be predicted from X1 and/or X2?
Which technique depends on measurement level of variables
3 levels of measurement are relevant (in this course):
● NOM: Nominal level - only distinguishes categories
- E.g. no therapy, psycho-dynamic, exposure
● INT: Interval level - if intervals meaningful / order
- E.g. weights, height, IQ score, BDI score (quasi-interval)
, ● BIN: Binary variables - has 2 categories (can be NOM or INT)
- E.g. pass / fail, male / female
X1, X2 Y Technique Abbreviation
INT INT Multiple regression Analysis MRA
NOM INT Analysis of variance ANOVA
NOM + INT INT Analysis of covariance ANCOVA
INT BIN Logistic regression analysis LRA
Remarks
● X1, X2 can also be BIN
● If Y is BIN, then we have to use LRA
Introduction
Multiple Regression Analysis (MRA)
Measurement levels:
● Dependent variable Y is INT
● Independent variables X1, X2 are INT
1) Illustrative (fictional) example
Health psychologist:
Can depression (Y) be predicted from life events (X1 and/or coping (X2)?
Psychologist conducts a study with 60 dutch adults
, - Asks participant about number of life events
- Uses test to measure coping index of participant
- Uses Beck Depression Inventory (BDI) to measure depression
All variables are INT
- Number of life events (0,1,2,3,...): e.g. financial difficulties, relationship troubles,
disease, etc.
- Coping index (1 = no coping, 10 = good coping)
- BDI score (0-9 minimal, 10-18 mild, 19-29 moderate, 30-63 severe depression)
2) Regression model
Can Y be predicted from X1 and/or X2? (Y, X1, X2 = INT)
Model that works really well:
Dependent variable Y is a linear function of predictors X1 and X2 (can be described by a
straight line)
Regression model
● Simple regression: Yi = b*0 + b*1 X1i + ei
● Multiple regression: Yi = b*0 + b*1 X1i + b*2 X2i + … + b*k Xki + ei
Where
● b*0 is the (population) regression constant
● b*1, b*2 and b*k are (population) regression coefficients
● X1i, X2i, Xki and Yi are the scores on X1, X2, Xk and Y of individual i
● ei is a residual (= error)
The parameters b*0, b*1, b*2 and b*k need to be estimated from the data (sample)
Linear Model: least squares estimation (e.g. SPSS)
Fit a Line
Linear model with one predictor
Simple regression - fit a straight line through a set of data points
- Each participant is a point
- Slope (the way it points upwards or downwards) is the regression coefficient
- If 0 the line would be flat, if positive (+) the line would slope up, if negative (-) the line
would slope down
, Regression Equation
Let Ŷi denote the prediction of Yi
Relationship: Ŷi = Ŷi + ei (actual data = regression model (what we think it should be) + error)
Regression equation:
● Simple regression: Ŷi = b0 + b1 X1i
● Multiple regression: Ŷi = b0 + b1 X1i + b2 X2i + … bk Xki
Where
● b0, b1, b2 and bk are estimate of b*0, b*1, b*2 and b*k
Best prediction (least squares) if the sum of squared differences is minimal
(Actual score of participant - predicted score of participant)²
Regression Line
With one predictor - regression line