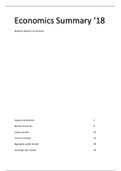
Three-Step Procedure of Market Research.
1. First step ‘What is the appropriate theoretical framework?’. Here I SET-UP the appropriate
diagram. This could be a demand-and-supply diagram representing the potato market.
2. Second step ‘Which curves in the diagram will shift and in which direction as a
consequence of the outside event?’ Here the SHIFTS would be limited to a shift to the left of
the supply curve. In this step I also have to explain why any shifts occur.
3. Third step ‘What is the effect of the shifts in curves on the variables alongside the axis of
the diagram (usually price and a quantity)?’ Here I SHOW the shifts in the diagram, and I can
point out that the price of potatoes increases, and the quantity of potatoes traded
decreases.
SLIDES LESSON 1: CONSUMER MODEL
Law of Demand Other things remaining the same, the higher the price of a good, the
smaller the quantity demanded; and the lower the price of a good, the greater is the quantity
demanded.
Demand or supply curve.
Price
Quantity
The consumer model.
Decisions to be made:
- Demand side:
Consumption (Goods Market)
Carrying Money or Bonds (Money Market)
Foreign Currency (Forex Market)
Supply side:
Labour (Labour Market)
, Decisions determined by:
- Preferences
- Budget restriction:
Prices
Interest rate
Exchange rate
Wage rate
Net taxes
Expectations
- Time Restriction:
Work and Leisure
Law of Demand (see a.): Change in Demand (Shift, see b.):
• Substitution Effect • Preferences (Marketing)
• Income Effect • Prices of Substitutes
• Prices of Complements
• Prices of Non-related Goods
• Interest Rate
• Exchange Rate
• Wage Rate
• Net Taxes
• Expectations
General Demand Curve
Price
b.
a.
Quantity
, A. Change in Price of the good will lead to a change in the buying plans (change of demand)
shift along the demand curve.
Why does a higher price reduce the quantity demanded? For 2 reasons:
- Substitution effect
When the price of a good rises, other things remaining the same, its relative price – its
opportunity costs – rises. Although each good is unique, it has substitutes – other goods that
can be used in its place. If you want to eat fruit and the price of bananas increases, you can
buy apples instead.
- Income effect
When the price of a good rises, other things remaining the same, the price rises relative to
income. Faced with a higher price and unchanged income, people cannot buy all the things
they previously bought. If price of meat increases, people will buy less meat.
Movement along the demand curve.
B. Any other factor (besides the price of a good) that influences buying plans (change in
demand) shift of the demand curve.
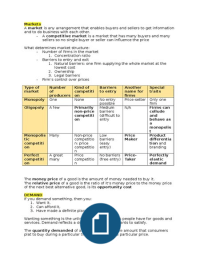
Perfect Competition
Characteristics of this market structure:
- Many suppliers sell identical products to many demanders: price takers.
- Perfect price competition.
- Barriers of entry are absent (is a term describing factors that can prevent or impede
newcomers into a market, and so limit competition. These can include high start-up costs,
regulatory hurdles, or other obstacles that prevent new competitors from easily entering a
business sector).
- Examples unprocessed foods, metals, oil and gas, secondary markets for financial assets,
private services like house cleaning.
Demand and Supply Diagram for Perfect Competition
Market for Good A
Supply
Price Demand
of A
Quantity of A
, - Demand Curve represents consumers.
See consumer model.
- Supply curve represents producers:
See producer model.
- 2 reasons why demand curve can shift:
1. A determinant of the consumer model changes (example: increase of preferences for good
A).
2. Number of consumers changes.
- A shift in the demand curve will change:
1. Equilibrium price.
2. Equilibrium quantity.
The equilibrium price is the price at which the quantity demanded equals the quantity
supplied.
CALCULATIONS
Elasticities of Quantity Demanded.
- Price-Elasticity if a group of consumers would react to a price change from 3 to 3.75 per
kilo of apples (25% increase) with a change in demand from 450,000 to 405,000 kilo per
month (10% decrease), the elasticity = 10%/25% = -0.4.
- Income-Elasticity if a group of consumers would react to an average income change from
2,000 to 2,100 per month (5% increase) with a change in demand from 450,000 to 495,000
kilo per month (10% increase), the elasticity = 10%/5% = 2.
- Cross-Elasticity if a group of consumers would react to a price change from 3 to 3.75 per
kilo of apples (25% increase) with a change in demand from 200,000 to 210,000 kilo of
bananas per month (5% increase), the elasticity is 5%/25% = 0.2.
1. First step ‘What is the appropriate theoretical framework?’. Here I SET-UP the appropriate
diagram. This could be a demand-and-supply diagram representing the potato market.
2. Second step ‘Which curves in the diagram will shift and in which direction as a
consequence of the outside event?’ Here the SHIFTS would be limited to a shift to the left of
the supply curve. In this step I also have to explain why any shifts occur.
3. Third step ‘What is the effect of the shifts in curves on the variables alongside the axis of
the diagram (usually price and a quantity)?’ Here I SHOW the shifts in the diagram, and I can
point out that the price of potatoes increases, and the quantity of potatoes traded
decreases.
SLIDES LESSON 1: CONSUMER MODEL
Law of Demand Other things remaining the same, the higher the price of a good, the
smaller the quantity demanded; and the lower the price of a good, the greater is the quantity
demanded.
Demand or supply curve.
Price
Quantity
The consumer model.
Decisions to be made:
- Demand side:
Consumption (Goods Market)
Carrying Money or Bonds (Money Market)
Foreign Currency (Forex Market)
Supply side:
Labour (Labour Market)
, Decisions determined by:
- Preferences
- Budget restriction:
Prices
Interest rate
Exchange rate
Wage rate
Net taxes
Expectations
- Time Restriction:
Work and Leisure
Law of Demand (see a.): Change in Demand (Shift, see b.):
• Substitution Effect • Preferences (Marketing)
• Income Effect • Prices of Substitutes
• Prices of Complements
• Prices of Non-related Goods
• Interest Rate
• Exchange Rate
• Wage Rate
• Net Taxes
• Expectations
General Demand Curve
Price
b.
a.
Quantity
, A. Change in Price of the good will lead to a change in the buying plans (change of demand)
shift along the demand curve.
Why does a higher price reduce the quantity demanded? For 2 reasons:
- Substitution effect
When the price of a good rises, other things remaining the same, its relative price – its
opportunity costs – rises. Although each good is unique, it has substitutes – other goods that
can be used in its place. If you want to eat fruit and the price of bananas increases, you can
buy apples instead.
- Income effect
When the price of a good rises, other things remaining the same, the price rises relative to
income. Faced with a higher price and unchanged income, people cannot buy all the things
they previously bought. If price of meat increases, people will buy less meat.
Movement along the demand curve.
B. Any other factor (besides the price of a good) that influences buying plans (change in
demand) shift of the demand curve.
Perfect Competition
Characteristics of this market structure:
- Many suppliers sell identical products to many demanders: price takers.
- Perfect price competition.
- Barriers of entry are absent (is a term describing factors that can prevent or impede
newcomers into a market, and so limit competition. These can include high start-up costs,
regulatory hurdles, or other obstacles that prevent new competitors from easily entering a
business sector).
- Examples unprocessed foods, metals, oil and gas, secondary markets for financial assets,
private services like house cleaning.
Demand and Supply Diagram for Perfect Competition
Market for Good A
Supply
Price Demand
of A
Quantity of A
, - Demand Curve represents consumers.
See consumer model.
- Supply curve represents producers:
See producer model.
- 2 reasons why demand curve can shift:
1. A determinant of the consumer model changes (example: increase of preferences for good
A).
2. Number of consumers changes.
- A shift in the demand curve will change:
1. Equilibrium price.
2. Equilibrium quantity.
The equilibrium price is the price at which the quantity demanded equals the quantity
supplied.
CALCULATIONS
Elasticities of Quantity Demanded.
- Price-Elasticity if a group of consumers would react to a price change from 3 to 3.75 per
kilo of apples (25% increase) with a change in demand from 450,000 to 405,000 kilo per
month (10% decrease), the elasticity = 10%/25% = -0.4.
- Income-Elasticity if a group of consumers would react to an average income change from
2,000 to 2,100 per month (5% increase) with a change in demand from 450,000 to 495,000
kilo per month (10% increase), the elasticity = 10%/5% = 2.
- Cross-Elasticity if a group of consumers would react to a price change from 3 to 3.75 per
kilo of apples (25% increase) with a change in demand from 200,000 to 210,000 kilo of
bananas per month (5% increase), the elasticity is 5%/25% = 0.2.