Forms of Urbanisation
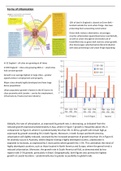
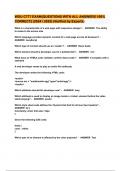
13% of land in England is classed as Green Belt –
located outside the rural-urban fringe. Has laws
protecting them preventing construction
Green belts reduce urbanisation, encourages
counter-urbanisation (guaranteed area is protected),
as well as urban resurgence (increased use of
brownfield sites as green belt restricts urban growth.
Also discourages suburbanisation/decentralisation
with laws preventing rural-urban fringe expanding
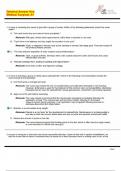
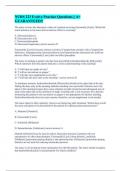
In SE England – all cities are growing at all times
In NW England – cities only growing 2001-1 – small cities
had constant growth
Growth is on average highest in large cities – greater
opportunities in employment and property
Major cities already highly developed and have large
dense populations
Urban population growth is fastest in the SE due to its
close proximity with London – centre for employment,
infrastructure, finance (service industry)
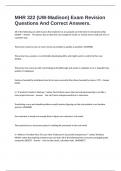
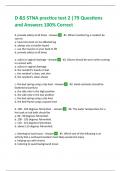
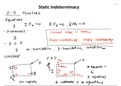
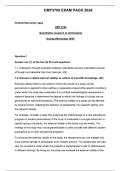
Globally, the rate of urbnaisation, as expressed by growth rate, is decreasing, as indicated from the
reduced grwoth expressed predominately in Asia, where in Figure 7 growth is frequently above 3%, in
comparision to Figure 8, where it is predominately less than 3%. In Africa, growth will remain high,as
ezpressed by growth exceeding 5% in both Figures. Moreover, in both Europe and North America,
urbanisation will slightly reduced, conveyed by the increased proportion of growth less than 1% in Figure 8.
An anomaly occurs in Australia, where despite it being a highly developed country, urbanisation is
expected to increases, as expressed by 2 more points where growth hits 1-3%. This contradicts the trend of
highly developed countires, such as those located in North America and Europe, where the genral trend is
reduced urbanisation. Moreover, the growth rate in South America will fall, as demonstrated by less
regions with 3-5% growth, particularly in Brazil. Geographically, both figures also portray the highest
growth at coastal locations – predominatly due to greater accessibility to global trade.
, Consequences of Urbanisation
Urban Sprawl
Negative Impacts:
➢ Requires more infrastructure – less economically efficient to service low density areas
➢ Wildlife habitat loss
➢ More commute from suburbs to city centre – increased fuel consumption, congestion, and pollution
➢ Worsens water quality/quantity by covering countryside with impermeable services – rainwater unable
to infiltrate into the ground and replenish aquifers. Also lead to greater surface runoff and flood risk
➢ Decentralisation caused decline of retail in city centres and increasing homogenisation
Housing Shortages in LIC’s:
High population density = housing shortages = large areas of informal housing in areas vulnerable to
environmental hazards/adjacent to transport networks – high levels of air/noise pollution. Limited access
to basic infrastructure e.g. water, electricity, and services e.g. schools, healthcare
UN Habitat estimated the number of people living in slums has increased from 600mn (1990) to 863mn –
Mumbai has 9 million slum dwellers, increasing from 6mn in 2005 – e.g. Dharavi
1 million live in informal settlements in Rio (favellas)
Millennium Development Goal 7 attempts to improve the quality of life of slum dwellers – UN reports 320
million slum dwellers have gained access to improved water resources or less dense housing
Example: Favela Bairro Project
Shortages of affordable housing in HIC’s:
Rapid urbanisation caused huge increase in demand for houses and therefore drastically increases prices
London – house prices rose 50% between 2010 and 2015 – due to in-migration and gentrification
Lack of urban services and waste disposal:
LIC’s – low economic growth = lack of investment = poor infrastructure and services
Maintenance of infrastructure limited, resulting in traffic congestion, flooding and disease spread
Example: 2015 – only 5% piped water reached slums in 42 cities/towns, including New Delhi
Waste disposal issues with rising populations e.g. Ethiopia only deal with 2/3 of rubbish
Unemployment/Under Employment:
Rate of urban population increase greater than rate of job creation
Under employment occurs when someone is working and not utilising their skills – often migrants
Transport Issues
Urbanisation/suburbanisation led to increased traffic congestion and pollution – reducing productivity
California study concluded that additional traffic from urbanisation takes up 90% new road capacity in 5yrs
13% of land in England is classed as Green Belt –
located outside the rural-urban fringe. Has laws
protecting them preventing construction
Green belts reduce urbanisation, encourages
counter-urbanisation (guaranteed area is protected),
as well as urban resurgence (increased use of
brownfield sites as green belt restricts urban growth.
Also discourages suburbanisation/decentralisation
with laws preventing rural-urban fringe expanding
In SE England – all cities are growing at all times
In NW England – cities only growing 2001-1 – small cities
had constant growth
Growth is on average highest in large cities – greater
opportunities in employment and property
Major cities already highly developed and have large
dense populations
Urban population growth is fastest in the SE due to its
close proximity with London – centre for employment,
infrastructure, finance (service industry)
Globally, the rate of urbnaisation, as expressed by growth rate, is decreasing, as indicated from the
reduced grwoth expressed predominately in Asia, where in Figure 7 growth is frequently above 3%, in
comparision to Figure 8, where it is predominately less than 3%. In Africa, growth will remain high,as
ezpressed by growth exceeding 5% in both Figures. Moreover, in both Europe and North America,
urbanisation will slightly reduced, conveyed by the increased proportion of growth less than 1% in Figure 8.
An anomaly occurs in Australia, where despite it being a highly developed country, urbanisation is
expected to increases, as expressed by 2 more points where growth hits 1-3%. This contradicts the trend of
highly developed countires, such as those located in North America and Europe, where the genral trend is
reduced urbanisation. Moreover, the growth rate in South America will fall, as demonstrated by less
regions with 3-5% growth, particularly in Brazil. Geographically, both figures also portray the highest
growth at coastal locations – predominatly due to greater accessibility to global trade.
, Consequences of Urbanisation
Urban Sprawl
Negative Impacts:
➢ Requires more infrastructure – less economically efficient to service low density areas
➢ Wildlife habitat loss
➢ More commute from suburbs to city centre – increased fuel consumption, congestion, and pollution
➢ Worsens water quality/quantity by covering countryside with impermeable services – rainwater unable
to infiltrate into the ground and replenish aquifers. Also lead to greater surface runoff and flood risk
➢ Decentralisation caused decline of retail in city centres and increasing homogenisation
Housing Shortages in LIC’s:
High population density = housing shortages = large areas of informal housing in areas vulnerable to
environmental hazards/adjacent to transport networks – high levels of air/noise pollution. Limited access
to basic infrastructure e.g. water, electricity, and services e.g. schools, healthcare
UN Habitat estimated the number of people living in slums has increased from 600mn (1990) to 863mn –
Mumbai has 9 million slum dwellers, increasing from 6mn in 2005 – e.g. Dharavi
1 million live in informal settlements in Rio (favellas)
Millennium Development Goal 7 attempts to improve the quality of life of slum dwellers – UN reports 320
million slum dwellers have gained access to improved water resources or less dense housing
Example: Favela Bairro Project
Shortages of affordable housing in HIC’s:
Rapid urbanisation caused huge increase in demand for houses and therefore drastically increases prices
London – house prices rose 50% between 2010 and 2015 – due to in-migration and gentrification
Lack of urban services and waste disposal:
LIC’s – low economic growth = lack of investment = poor infrastructure and services
Maintenance of infrastructure limited, resulting in traffic congestion, flooding and disease spread
Example: 2015 – only 5% piped water reached slums in 42 cities/towns, including New Delhi
Waste disposal issues with rising populations e.g. Ethiopia only deal with 2/3 of rubbish
Unemployment/Under Employment:
Rate of urban population increase greater than rate of job creation
Under employment occurs when someone is working and not utilising their skills – often migrants
Transport Issues
Urbanisation/suburbanisation led to increased traffic congestion and pollution – reducing productivity
California study concluded that additional traffic from urbanisation takes up 90% new road capacity in 5yrs