

CHAPTER 41: THE CIRCULAR FLOW OF INCOME
41.1: The m u ltiplier
- Multiplier: The multiplier refers to the process by which an initial increase in aggregate demand leads to a
larger final increase in national income (initiated by autonomous behaviors).
- Formula:
Change∈real income∨GDP
+
Change∈injections
1
+ withdraw ∨(1−Marginal propensity¿ consume)¿
Marginal propensity ¿
- Mechanism:
+ The process begins with an initial injection of new spending into the economy.
+ This initial spending immediately becomes income for the recipients (e.g. construction workers,
engineers).
+ The individuals and businesses who just earned this new income will spend a portion of it on
various goods and services based on their Marginal Propensity to Consume.
● MPC + MPS = 1
● MPC: The fraction of extra income that a person or economy spends on new goods and
services, rather than saves → higher MPC → larger multiplier.
Change∈consumption
○
Change∈income
Consumption
○ APC =
Change∈income
● Marginal Propensity to Save (MPS): The proportion of an increase in income that is saved →
higher MPS → greater leakage → smaller multiplier
Change∈savings
○
Change∈income
Savings
○ APS =
Income
+ This cycle of spending and re-spending continues. With each round, the amount of additional
spending gets smaller because of leakages.
+ Eventually, the extra spending in each round becomes negligible, and the process tapers off.
+ The cumulative effect of all these rounds of spending is a total increase in national income that is a
multiple of the initial injection.
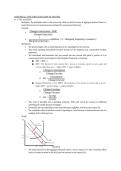
- Graph:
+ The initial increase in AD (aggregate demand) causes a rise in output to Y2. But, secondary effects
lead to a further increase in AD (AD3) and an increase in real output (Y3).
,- The multiplier and equilibrium national income:
+ Closed economy:
- Without government: 2 sectors (households and firms) → multiplier = 1/MPS.
● Equilibrium occurs: Aggregate expenditure = output or C + I = Y (spending =
output).
● If C + I > Y → national income rises
● If C + I < Y → national income falls
- With government: households, firms and government → multiplier = 1/MPS + MRT.
● Equilibrium income is achieved where aggregate expenditure = output (C + I + G
= Y) and injections equals withdrawals (I + G = S + T).
1
+ Open economy: (equilibrium at C + I + G + (X − M) = Y)
MPS+ MRT + MPM
- Average and MRT:
+ Average = T/Y
+ MRM = ∆T/∆Y
- Average and MRM:
+ Average = M/Y
+ MRM = ∆M/∆Y
- National income determination:
+ Aggregate demand = aggregate supply OR aggregate expenditure = output
- Firms produce goods and services → this creates income. Households and other sectors spend
this income. If planned spending equals output, firms will sell all goods produced, no reason to
change production.
+ AE > output:
- Falling inventories → increase production → employ more FOPs → output and national
income rise.
+ AE < output:
- Rising inventories → reduce production → laying off workers → output and national income
fall.
- Keynesian diagram:
+
+ Represents all points where aggregate expenditure (AE) equals aggregate output (Y), or real GDP.
+ This line serves as a reference for the macroeconomy, with the intersection of the upward-sloping
AE curve and the 45-degree line identifying the actual equilibrium level of national income and
output.
+ If aggregate expenditure exceeds current output, firms will seek to produce more. They will employ
more factors of production and GDP will rise.
, + If aggregate expenditure is below current output, firms will reduce production. So, output will
change until it matches expenditure.
+ Difference between AD and AE:
- AD: spending against price level
- AE: spending against income level
- The effect of changing aggregate demand on national income:
+
+ Initial rise in spending is an injection. Each round of spending creates further income.
+ Final rise in income = injection * multiplier.
41.2: Com ponents of aggr egate dem and and their deter m inants
- The consumption function: Autonomous and induced consumer expenditure.
+ C = a +bY (as income rises, consumption also rises, but by less than the increase in income).
+ C = Consumption.
+ a = Autonomous consumption (consumption that occurs even when income is zero - basic goods →
funded by savings, borrowings, welfare).
+ b = Marginal propensity to consume (MPC - lies between 0 and 1).
+ Y = National income.
+ Shapes:
- Upward: Higher income = higher consumption.
- MPC = slope and strength of multiplier.
- Less than 45 degrees: Not all extra income is spent.
+ Shift of the consumption function:
- Fiscal policy
- Monetary policy
- Consumer confidence
- Exchange rates
+ Multiplier:
- Higher MPC: Smaller leakage → larger multiplier.
- Lower MPC: Larger leakage → smaller multiplier.
- The saving function: Autonomous and induced savings.
+ S = –a + sY
+ S = saving.
+ s = the marginal propensity to save.
+ Y = income.
+ a = autonomous dissaving (at 0 income, households still buy basic goods → saving is negative).
+ sY = induced saving.
+ Shapes:
- Upward sloping: Higher income leads to higher saving.
41.1: The m u ltiplier
- Multiplier: The multiplier refers to the process by which an initial increase in aggregate demand leads to a
larger final increase in national income (initiated by autonomous behaviors).
- Formula:
Change∈real income∨GDP
+
Change∈injections
1
+ withdraw ∨(1−Marginal propensity¿ consume)¿
Marginal propensity ¿
- Mechanism:
+ The process begins with an initial injection of new spending into the economy.
+ This initial spending immediately becomes income for the recipients (e.g. construction workers,
engineers).
+ The individuals and businesses who just earned this new income will spend a portion of it on
various goods and services based on their Marginal Propensity to Consume.
● MPC + MPS = 1
● MPC: The fraction of extra income that a person or economy spends on new goods and
services, rather than saves → higher MPC → larger multiplier.
Change∈consumption
○
Change∈income
Consumption
○ APC =
Change∈income
● Marginal Propensity to Save (MPS): The proportion of an increase in income that is saved →
higher MPS → greater leakage → smaller multiplier
Change∈savings
○
Change∈income
Savings
○ APS =
Income
+ This cycle of spending and re-spending continues. With each round, the amount of additional
spending gets smaller because of leakages.
+ Eventually, the extra spending in each round becomes negligible, and the process tapers off.
+ The cumulative effect of all these rounds of spending is a total increase in national income that is a
multiple of the initial injection.
- Graph:
+ The initial increase in AD (aggregate demand) causes a rise in output to Y2. But, secondary effects
lead to a further increase in AD (AD3) and an increase in real output (Y3).
,- The multiplier and equilibrium national income:
+ Closed economy:
- Without government: 2 sectors (households and firms) → multiplier = 1/MPS.
● Equilibrium occurs: Aggregate expenditure = output or C + I = Y (spending =
output).
● If C + I > Y → national income rises
● If C + I < Y → national income falls
- With government: households, firms and government → multiplier = 1/MPS + MRT.
● Equilibrium income is achieved where aggregate expenditure = output (C + I + G
= Y) and injections equals withdrawals (I + G = S + T).
1
+ Open economy: (equilibrium at C + I + G + (X − M) = Y)
MPS+ MRT + MPM
- Average and MRT:
+ Average = T/Y
+ MRM = ∆T/∆Y
- Average and MRM:
+ Average = M/Y
+ MRM = ∆M/∆Y
- National income determination:
+ Aggregate demand = aggregate supply OR aggregate expenditure = output
- Firms produce goods and services → this creates income. Households and other sectors spend
this income. If planned spending equals output, firms will sell all goods produced, no reason to
change production.
+ AE > output:
- Falling inventories → increase production → employ more FOPs → output and national
income rise.
+ AE < output:
- Rising inventories → reduce production → laying off workers → output and national income
fall.
- Keynesian diagram:
+
+ Represents all points where aggregate expenditure (AE) equals aggregate output (Y), or real GDP.
+ This line serves as a reference for the macroeconomy, with the intersection of the upward-sloping
AE curve and the 45-degree line identifying the actual equilibrium level of national income and
output.
+ If aggregate expenditure exceeds current output, firms will seek to produce more. They will employ
more factors of production and GDP will rise.
, + If aggregate expenditure is below current output, firms will reduce production. So, output will
change until it matches expenditure.
+ Difference between AD and AE:
- AD: spending against price level
- AE: spending against income level
- The effect of changing aggregate demand on national income:
+
+ Initial rise in spending is an injection. Each round of spending creates further income.
+ Final rise in income = injection * multiplier.
41.2: Com ponents of aggr egate dem and and their deter m inants
- The consumption function: Autonomous and induced consumer expenditure.
+ C = a +bY (as income rises, consumption also rises, but by less than the increase in income).
+ C = Consumption.
+ a = Autonomous consumption (consumption that occurs even when income is zero - basic goods →
funded by savings, borrowings, welfare).
+ b = Marginal propensity to consume (MPC - lies between 0 and 1).
+ Y = National income.
+ Shapes:
- Upward: Higher income = higher consumption.
- MPC = slope and strength of multiplier.
- Less than 45 degrees: Not all extra income is spent.
+ Shift of the consumption function:
- Fiscal policy
- Monetary policy
- Consumer confidence
- Exchange rates
+ Multiplier:
- Higher MPC: Smaller leakage → larger multiplier.
- Lower MPC: Larger leakage → smaller multiplier.
- The saving function: Autonomous and induced savings.
+ S = –a + sY
+ S = saving.
+ s = the marginal propensity to save.
+ Y = income.
+ a = autonomous dissaving (at 0 income, households still buy basic goods → saving is negative).
+ sY = induced saving.
+ Shapes:
- Upward sloping: Higher income leads to higher saving.

