SV WO Statistics
Lecture 1- Fundamentals I
Definition & usefulness
➢ Statistics: the study of the collection, organization and interpretation of data.
➢ To contribute to the accuracy and reliability of the evidence we argue for our ideas →
Organize and systematize information data (what happened in a study and communicate it to
others)
➢ To interpret research findings on the basis of numbers: Is there a systematic factor behind
observed differences?
➢ To help bring order out of chaos
What is measured
➢ Objects: things
o Concrete things: people, countries
➢ Properties: Characteristics of objects
➢ Measurements: indicants of properties (of objects)
Useful definitions
➢ Variable: A characteristic or condition that changes or has different
values for different individuals
➢ Data (plural): Measurements or observations. Data set is a collection of
data. Datum (singular) is a single measurement, often referred to as
score or raw score
➢ Descriptive statistics: Statistical procedures to summarize, organize and
simplify data
➢ Inferential statistics: Techniques that study samples and make generalizations about
populations from which the samples were selected
Measurement scales for variables
➢ Nominal
o A set of categories with different names. Comparison operation possible for:
(in)equality: “are two individuals different?
o Values are exhaustive and mutually exclusive
o Bv gender
o But does not specify: “how much different”: no “more than” or “less than”
➢ Ordinal
o A set of categories with different names and organized in ordered sequence (of size,
etc) Comparison operation possible for:
(in)equality: “are two individuals different?
o Order: “more than”, “less than
o Bv highest attained education (primary, high, uni)
o But does not specify: “how much larger” or “how much smaller
➢ Interval
o Ordered categories with in-between intervals of exactly the same size
o Comparison possible for:
▪ (in)equality: “are two individuals different?
▪ Order: “more than”, “less than”
1
, ▪ Distance/difference: “how much more than”/”less than”? (equal differences
between numbers on the scale mean equal differences in magnitude)
o No natural zero value! (= absence of)
o Bv temperatuur, age in categories
o Understand: Zero temperature on this scale does not mean absence of temperature
➢ Ratio
o Interval scale with absolute zero point (can have “zero amount of” type of variable)
allowing to measure ratios
o Comparison possible for:
▪ (in)equality: “are two individuals different?”
▪ Order: “more than”, “less than”
▪ Distance/difference: “how much more than”/”less than”? (equal differences
between numbers on the scale mean equal differences in magnitude)
o Bv gewicht (0 kilos of apples)
o Understand: An individual of 100 kilos (100 from zero) weighs twice as much as
some of 50 kilos → allows measuring ratios
o Has natural zero value, and no negative values!
Summarizing data
Descriptive measures:
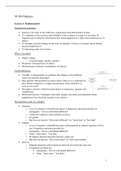
➢ Frequency measurements
o Frequency distributions: Help us organize and present way data in a comprehensive
form; An “organized picture of the data”
o Can be presented as: Tables (quickly identify trends),
Pie charts, Graphs
▪ Frequency graph: A picture of the information
available on frequency table
• Absolute frequencies: Firefox: 21 (out
of 500)
• Relative frequencies: 0.042 (also:
proportion) 4.2% (also: percentage)
▪ Graph: Space between adjacent bars
• Visually emphasizing: nominal scale (scale has distinct categories) &
ordinal scale (cannot assume all categories to be of equal size)
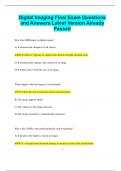
▪ Histogram: No space between adjacent bars
• Visually emphasizing: Interval or ratio scale (all categories are of
equal size)
➢ Measure of location/central tendency
o The most common method of summarizing the distribution of some data is a
statistical measure called central tendency
o Purpose:
▪ Identify center of the distribution
▪ Identify best representative score
o You can think of central tendency as the “typical” individual score
o It is an example of “number crunching”:
▪ Take a distribution of many scores
▪ “Crunch” them down to a single value that describes them all
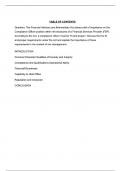
o Mean: Equilibrium or balance point of the distribution (average)
2
, ▪ Thinking of the mean as a balance point helps us visualize
how the distribution is affected when new scores are
added/subtracted
▪ 2 formulas for mean: population and sample
• Population: Set of all the individuals of interest in
a particular study. The size of the population is
usually denoted as: N. The mean µ is a parameter
of the population, and usually unknown.
• Sample: Selection of individuals from a population, usually to
represent the population in a particular study. The size of the sample
is usually denoted as: n. The mean X is a statistic, a value obtained
from the sample, which is used as an estimate for the unknown
population parameter.
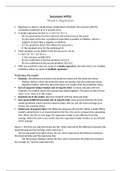
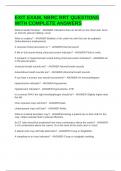
o Median: Midpoint of the distribution. Insensitive with respect to ’outliers’ (contrary
to mean)
▪ The Median represents the “midpoint” of the scores in
a distribution when they are listed in order from
smallest to largest. Divides the groups into two groups
of equal size. 50% of scores above, 50% below
median (=50-th percentile P50). No symbol, simply
referred to as median. Same for sample and population
o Mode: Most frequently occuring value
▪ Bimodal/multimodal: more than one value is most
frequent
▪ Most common observation Score with highest
frequency No special notation, referred to as “mode”
Same for population and sample Only central
tendency metric that can describe nominal scale
values A distribution can have multiple modes
(bimodal/multimodal)
➢ Measure of spread/ dispersion / variability
o Variability: “How much” different are the scores of a
distribution and how much they are spread out or clustered
together
▪ Important statistical measure because:
• Describes the distribution
• Tells us how much error to expect when using a sample to represent
the population
o Range: Difference between largest and smallest score of
distribution
▪ Problem using range as measure of variability→
completely determined by the two extreme values and
ignores the other values in the distribution
o Variance: Average of the squared distances (deviations) from
the mean
o Degrees of freedom
▪ Number of scores in sample that are independent
and free to vary
▪ Degrees of freedom df = n − 1
3
Lecture 1- Fundamentals I
Definition & usefulness
➢ Statistics: the study of the collection, organization and interpretation of data.
➢ To contribute to the accuracy and reliability of the evidence we argue for our ideas →
Organize and systematize information data (what happened in a study and communicate it to
others)
➢ To interpret research findings on the basis of numbers: Is there a systematic factor behind
observed differences?
➢ To help bring order out of chaos
What is measured
➢ Objects: things
o Concrete things: people, countries
➢ Properties: Characteristics of objects
➢ Measurements: indicants of properties (of objects)
Useful definitions
➢ Variable: A characteristic or condition that changes or has different
values for different individuals
➢ Data (plural): Measurements or observations. Data set is a collection of
data. Datum (singular) is a single measurement, often referred to as
score or raw score
➢ Descriptive statistics: Statistical procedures to summarize, organize and
simplify data
➢ Inferential statistics: Techniques that study samples and make generalizations about
populations from which the samples were selected
Measurement scales for variables
➢ Nominal
o A set of categories with different names. Comparison operation possible for:
(in)equality: “are two individuals different?
o Values are exhaustive and mutually exclusive
o Bv gender
o But does not specify: “how much different”: no “more than” or “less than”
➢ Ordinal
o A set of categories with different names and organized in ordered sequence (of size,
etc) Comparison operation possible for:
(in)equality: “are two individuals different?
o Order: “more than”, “less than
o Bv highest attained education (primary, high, uni)
o But does not specify: “how much larger” or “how much smaller
➢ Interval
o Ordered categories with in-between intervals of exactly the same size
o Comparison possible for:
▪ (in)equality: “are two individuals different?
▪ Order: “more than”, “less than”
1
, ▪ Distance/difference: “how much more than”/”less than”? (equal differences
between numbers on the scale mean equal differences in magnitude)
o No natural zero value! (= absence of)
o Bv temperatuur, age in categories
o Understand: Zero temperature on this scale does not mean absence of temperature
➢ Ratio
o Interval scale with absolute zero point (can have “zero amount of” type of variable)
allowing to measure ratios
o Comparison possible for:
▪ (in)equality: “are two individuals different?”
▪ Order: “more than”, “less than”
▪ Distance/difference: “how much more than”/”less than”? (equal differences
between numbers on the scale mean equal differences in magnitude)
o Bv gewicht (0 kilos of apples)
o Understand: An individual of 100 kilos (100 from zero) weighs twice as much as
some of 50 kilos → allows measuring ratios
o Has natural zero value, and no negative values!
Summarizing data
Descriptive measures:
➢ Frequency measurements
o Frequency distributions: Help us organize and present way data in a comprehensive
form; An “organized picture of the data”
o Can be presented as: Tables (quickly identify trends),
Pie charts, Graphs
▪ Frequency graph: A picture of the information
available on frequency table
• Absolute frequencies: Firefox: 21 (out
of 500)
• Relative frequencies: 0.042 (also:
proportion) 4.2% (also: percentage)
▪ Graph: Space between adjacent bars
• Visually emphasizing: nominal scale (scale has distinct categories) &
ordinal scale (cannot assume all categories to be of equal size)
▪ Histogram: No space between adjacent bars
• Visually emphasizing: Interval or ratio scale (all categories are of
equal size)
➢ Measure of location/central tendency
o The most common method of summarizing the distribution of some data is a
statistical measure called central tendency
o Purpose:
▪ Identify center of the distribution
▪ Identify best representative score
o You can think of central tendency as the “typical” individual score
o It is an example of “number crunching”:
▪ Take a distribution of many scores
▪ “Crunch” them down to a single value that describes them all
o Mean: Equilibrium or balance point of the distribution (average)
2
, ▪ Thinking of the mean as a balance point helps us visualize
how the distribution is affected when new scores are
added/subtracted
▪ 2 formulas for mean: population and sample
• Population: Set of all the individuals of interest in
a particular study. The size of the population is
usually denoted as: N. The mean µ is a parameter
of the population, and usually unknown.
• Sample: Selection of individuals from a population, usually to
represent the population in a particular study. The size of the sample
is usually denoted as: n. The mean X is a statistic, a value obtained
from the sample, which is used as an estimate for the unknown
population parameter.
o Median: Midpoint of the distribution. Insensitive with respect to ’outliers’ (contrary
to mean)
▪ The Median represents the “midpoint” of the scores in
a distribution when they are listed in order from
smallest to largest. Divides the groups into two groups
of equal size. 50% of scores above, 50% below
median (=50-th percentile P50). No symbol, simply
referred to as median. Same for sample and population
o Mode: Most frequently occuring value
▪ Bimodal/multimodal: more than one value is most
frequent
▪ Most common observation Score with highest
frequency No special notation, referred to as “mode”
Same for population and sample Only central
tendency metric that can describe nominal scale
values A distribution can have multiple modes
(bimodal/multimodal)
➢ Measure of spread/ dispersion / variability
o Variability: “How much” different are the scores of a
distribution and how much they are spread out or clustered
together
▪ Important statistical measure because:
• Describes the distribution
• Tells us how much error to expect when using a sample to represent
the population
o Range: Difference between largest and smallest score of
distribution
▪ Problem using range as measure of variability→
completely determined by the two extreme values and
ignores the other values in the distribution
o Variance: Average of the squared distances (deviations) from
the mean
o Degrees of freedom
▪ Number of scores in sample that are independent
and free to vary
▪ Degrees of freedom df = n − 1
3