ECONOMIC GROWTH
& INSTITUTIONS:
SUMMARY
@ECOsummaries
→ 20% discount
1
,Table of contents
Week 1_________________________________________________page 3-6
Week 2_________________________________________________page 7-12
Week 3_________________________________________________page 13-16
Week 4_________________________________________________page 17-19
Week 5_________________________________________________page 20-25
Week 6_________________________________________________page 26-30
Week 7_________________________________________________page 31-35
Week 8_________________________________________________page 36-41
Week 9_________________________________________________page 42-45
Week 10________________________________________________page 46-51
Week 11________________________________________________page 52-54
Week 12________________________________________________page 55-58
2
,Week 1 - Facts of economic growth
Facts to be explained
1. Differences across countries today
Rich vs. Poor
2. Differences across countries over time
Growth experiences
3. Differences over time
Global income level,
Growth rates within countries,
Relative position of countries.
Comparing average income of a country:
Measures:
Constant prices: used when comparing old money vs
new money.
Example: comparing $ from 1932 with $ from 2020.
→ So, the data comes from a single year and hence
constant over time.
Purchasing Power Parity (PPP): corrects for different purchasing power between countries.
Example: you cannot buy the same with 1$ in the US compared to India.
Fact 1: enormous variation in per capita income across countries
GDP per capita: GDP / population.
GDP per worker: GDP / workforce.
→ Usually interpreted as productivity measure (rather than a welfare measure).
→ In this course, we will not differentiate between these two. Since, in the long-run.
workers=population.
3
,Limitations of GDPpc as a statistic for welfare comparison:
- Other dimensions matter: environment, quality of public services.
Example: 2 countries have the same GDP, but one of the countries uses only green energy
and the other uses dirty energy.
- Economic growth has winners & losers.
→ Redistributive policies may be worse from the perspective of economic growth, but
necessary for some groups and their welfare.
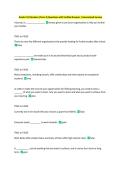
Fact 2: diverse growth experiences, success & failure
Average yearly growth rate GDPpc:
Japan closes the gap with the US, but S-S Africa increases the gap with the US because it grows at half
the pace of the US.
4
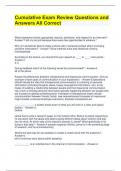
,Fact 3: growth rates are not generally constant over time
There is a huge variation in growth
rates over a long period of time.
Tip: the slopes of the lines are the
growth rates of these periods.
→ This is because the vertical axis is
in a logarithmic scale.
This also holds for within countries.
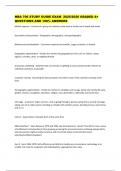
Fact 4: Relative position of countries can change
The countries above + to the
left of the US in the graph
were poorer in 1960 than the
US, but they grew faster than
the US in 1960-2011.
Conclusion: countries are not
doomed to stay poor forever
i.c.t. the US, they can get
closer or maybe even
overtake!
5
, Countries like South-Korea
and India grew
tremendously. They grew
from the bottom of the life
expectancy graph to the top
during 1950-2012!
Stylized facts (industrialized countries) ~ Kaldor Facts (1961)
Long run for industrialized countries:
1. The ratio of capital to output has been constant (K/Y = constant in the LR).
2. Capital per worker has grown at a sustained rate (K/L > 0).
→ (1+2): output per worker has grown at a sustained rate ((K/L)/(Y/L)).
→ Numerator & denominator grow equally.
3. Capital and labour have captured stable shares of national income.
4. (2+3): wages have grown at a sustained rate.
5. (1+3): the real interest rate has been stable.
Corresponding graphs for previous statements:
6
& INSTITUTIONS:
SUMMARY
@ECOsummaries
→ 20% discount
1
,Table of contents
Week 1_________________________________________________page 3-6
Week 2_________________________________________________page 7-12
Week 3_________________________________________________page 13-16
Week 4_________________________________________________page 17-19
Week 5_________________________________________________page 20-25
Week 6_________________________________________________page 26-30
Week 7_________________________________________________page 31-35
Week 8_________________________________________________page 36-41
Week 9_________________________________________________page 42-45
Week 10________________________________________________page 46-51
Week 11________________________________________________page 52-54
Week 12________________________________________________page 55-58
2
,Week 1 - Facts of economic growth
Facts to be explained
1. Differences across countries today
Rich vs. Poor
2. Differences across countries over time
Growth experiences
3. Differences over time
Global income level,
Growth rates within countries,
Relative position of countries.
Comparing average income of a country:
Measures:
Constant prices: used when comparing old money vs
new money.
Example: comparing $ from 1932 with $ from 2020.
→ So, the data comes from a single year and hence
constant over time.
Purchasing Power Parity (PPP): corrects for different purchasing power between countries.
Example: you cannot buy the same with 1$ in the US compared to India.
Fact 1: enormous variation in per capita income across countries
GDP per capita: GDP / population.
GDP per worker: GDP / workforce.
→ Usually interpreted as productivity measure (rather than a welfare measure).
→ In this course, we will not differentiate between these two. Since, in the long-run.
workers=population.
3
,Limitations of GDPpc as a statistic for welfare comparison:
- Other dimensions matter: environment, quality of public services.
Example: 2 countries have the same GDP, but one of the countries uses only green energy
and the other uses dirty energy.
- Economic growth has winners & losers.
→ Redistributive policies may be worse from the perspective of economic growth, but
necessary for some groups and their welfare.
Fact 2: diverse growth experiences, success & failure
Average yearly growth rate GDPpc:
Japan closes the gap with the US, but S-S Africa increases the gap with the US because it grows at half
the pace of the US.
4
,Fact 3: growth rates are not generally constant over time
There is a huge variation in growth
rates over a long period of time.
Tip: the slopes of the lines are the
growth rates of these periods.
→ This is because the vertical axis is
in a logarithmic scale.
This also holds for within countries.
Fact 4: Relative position of countries can change
The countries above + to the
left of the US in the graph
were poorer in 1960 than the
US, but they grew faster than
the US in 1960-2011.
Conclusion: countries are not
doomed to stay poor forever
i.c.t. the US, they can get
closer or maybe even
overtake!
5
, Countries like South-Korea
and India grew
tremendously. They grew
from the bottom of the life
expectancy graph to the top
during 1950-2012!
Stylized facts (industrialized countries) ~ Kaldor Facts (1961)
Long run for industrialized countries:
1. The ratio of capital to output has been constant (K/Y = constant in the LR).
2. Capital per worker has grown at a sustained rate (K/L > 0).
→ (1+2): output per worker has grown at a sustained rate ((K/L)/(Y/L)).
→ Numerator & denominator grow equally.
3. Capital and labour have captured stable shares of national income.
4. (2+3): wages have grown at a sustained rate.
5. (1+3): the real interest rate has been stable.
Corresponding graphs for previous statements:
6